How DTC Brands Use AI Analytics to Cut CAC and Grow LTV
AI analytics pay off only when they lead to faster, better decisions. The full framework is in the AI-driven decision-making guide for Shopify DTC founders.
AI analytics is one of the most underused levers in DTC. Many Shopify brands spend heavily on paid ads and judge success by the ROAS the ad platforms report. Those platform numbers tend to flatter the platform. A brand can grow revenue while its profit quietly slips, and the dashboard won’t say why.
Brands that improve their unit economics (lower CAC, higher LTV, better net margin) tend to use AI analytics in three ways. They replace platform data with first-party attribution. They find out which customers are worth more. And they automate the actions that keep those customers buying.
This guide walks through exactly how they do it.
The CAC problem most Shopify brands ignore
Customer acquisition cost isn’t what your ad platform says it is.
When Meta reports a $32 CAC on your campaign, that number comes from its own attribution model. Meta credits the sale to its ads, whatever else shaped the decision. Your real CAC is often higher than the platform number, because:
- Email and organic touchpoints that drove early intent get zero credit
- View-through conversions inflate attributed revenue by counting people who saw an ad but would have purchased anyway
- Cross-device journeys are misattributed or dropped entirely after iOS 14+
The result: founders push money toward channels that look good on paper but do poorly in reality. Budget flows to the wrong places. CAC creeps up quarter by quarter. And because the dashboard shows positive ROAS, nobody notices until the margin is gone.
The fix: Replace platform-reported attribution with first-party data. That’s what AI analytics tools like Triple Whale do — and it’s where the CAC reduction starts.
What AI analytics actually changes
AI analytics for DTC brands means using machine learning tools to replace shaky platform data with first-party attribution, predictive customer scores, and automated performance checks. A standard ecommerce dashboard tells you what happened. AI analytics tools also tell you why, and what to do next. The core functions are: multi-touch attribution that tracks the full customer journey across channels; predictive CLV scoring that spots which customers will be worth the most over time; and anomaly detection that flags performance drops before they get expensive.
There are three levers AI analytics moves:
1. Attribution accuracy — Understanding which channel actually drove each conversion, not which one got the last click. This directly changes where you allocate budget.
2. Customer segmentation — Identifying which customers have the highest predicted lifetime value before you’ve seen their second purchase. This changes who you target with retention spend.
3. Anomaly detection: get an alert when conversion rate drops, a channel turns unprofitable, or a customer segment starts to churn. You hear about it before the monthly report shows the damage. Not every drop is real, though: the Shopify session measurement update moved conversion rates in September 2026 without any change in sales.
How to use AI analytics to cut CAC
Step 1 — Get real attribution data
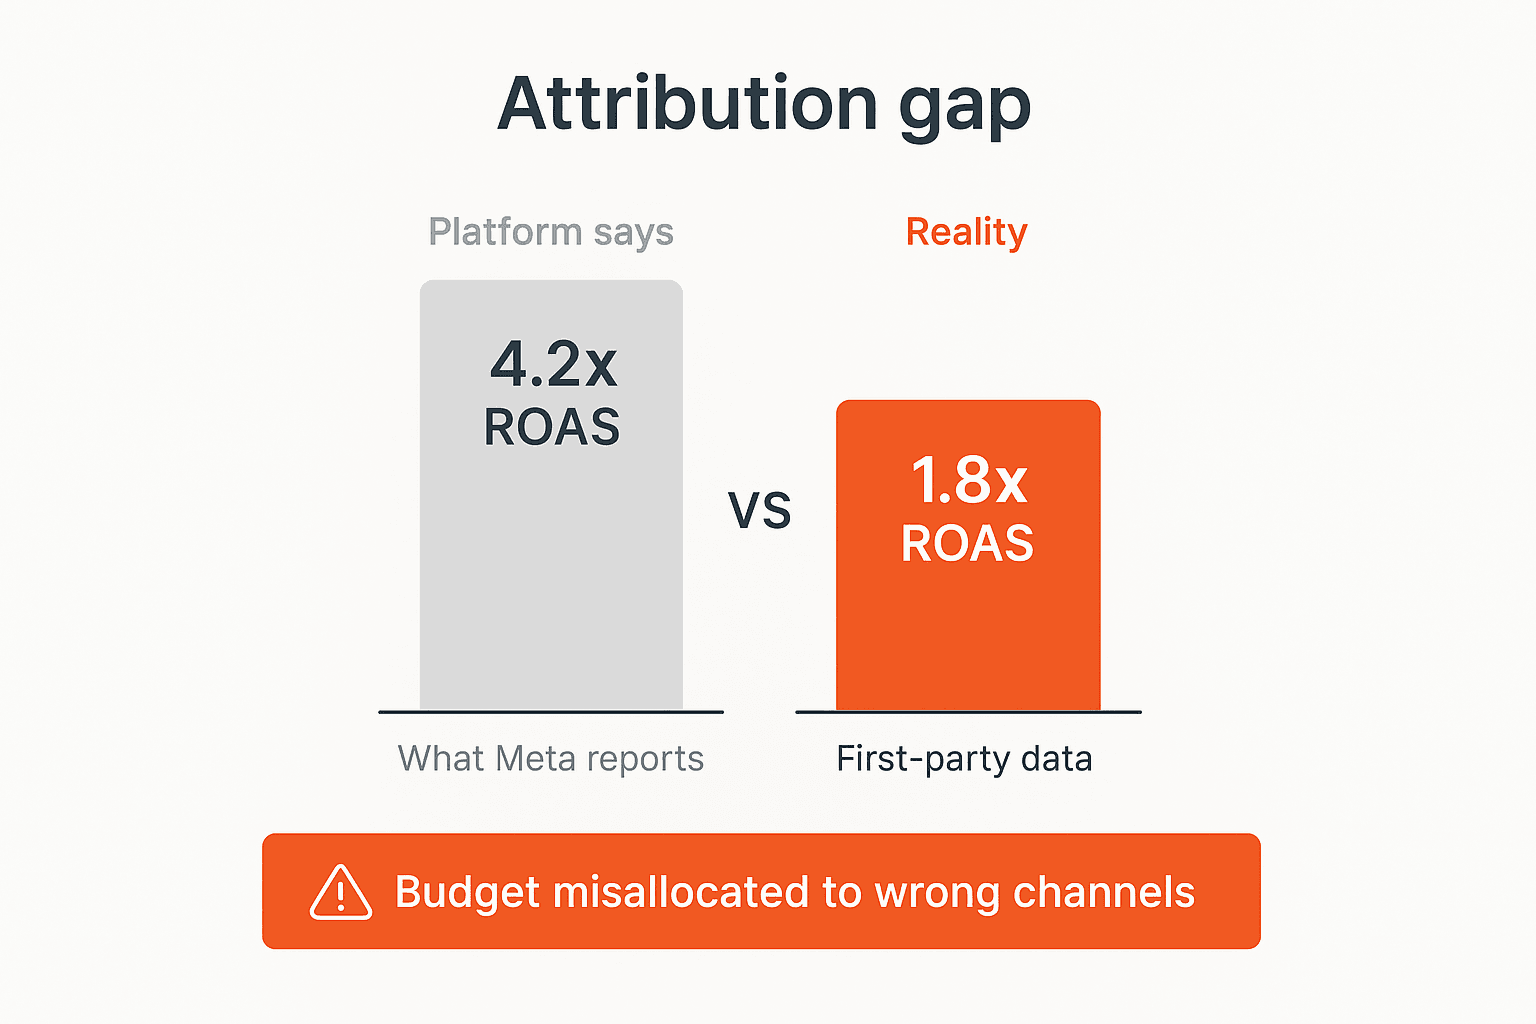
Install a first-party pixel that tracks the customer journey on its own, apart from Meta and Google. Triple Whale’s pixel runs on your Shopify store and records each touchpoint (first click, assists, and last click) without relying on platform cookies.
Once installed, run your campaigns for 30 days. Then compare:
– Platform-reported ROAS (what Meta and Google say)
– True ROAS from Triple Whale (what actually happened)
In most stores, you’ll find one or two channels significantly overperforming their platform number, and one or two significantly underperforming. This gap is your immediate CAC reduction opportunity.
Step 2 — Identify your highest-ROI channels
Triple Whale’s attribution dashboard shows true ROAS by channel, campaign, and creative. The goal isn’t to find the channel with the highest ROAS. It’s to find where the next dollar you spend earns the most.
A channel at 4.2x true ROAS that already gets 60% of your budget has less room to grow than an underfunded channel at 3.1x. AI analytics spots these imbalances for you.
Moby AI, Triple Whale’s AI analyst, can run this analysis and give plain-language suggestions. For example: “Your Meta prospecting campaigns are at 1.4x true ROAS. Your Google Shopping is at 3.8x. Shifting $3,000/month from Meta to Google Shopping is the highest-confidence CAC improvement available.”
Step 3 — Cut or reallocate the underperformers
With accurate attribution, budget reallocation becomes math instead of gut feel. The typical outcome for a brand moving from platform-reported to first-party attribution:
- 20-30% of ad budget reallocated within 60 days
- Blended CAC drops 15-30% without reducing total spend
- ROAS improves because the same budget is now in better-performing channels
This is the fastest path to CAC reduction available — no new creatives, no new targeting. Just accurate data.
→ See the full Triple Whale breakdown in the Triple Whale review 2026
How to use AI analytics to grow LTV
Cutting CAC is half the equation. The other half is making each customer worth more over time.
Segment by predicted CLV
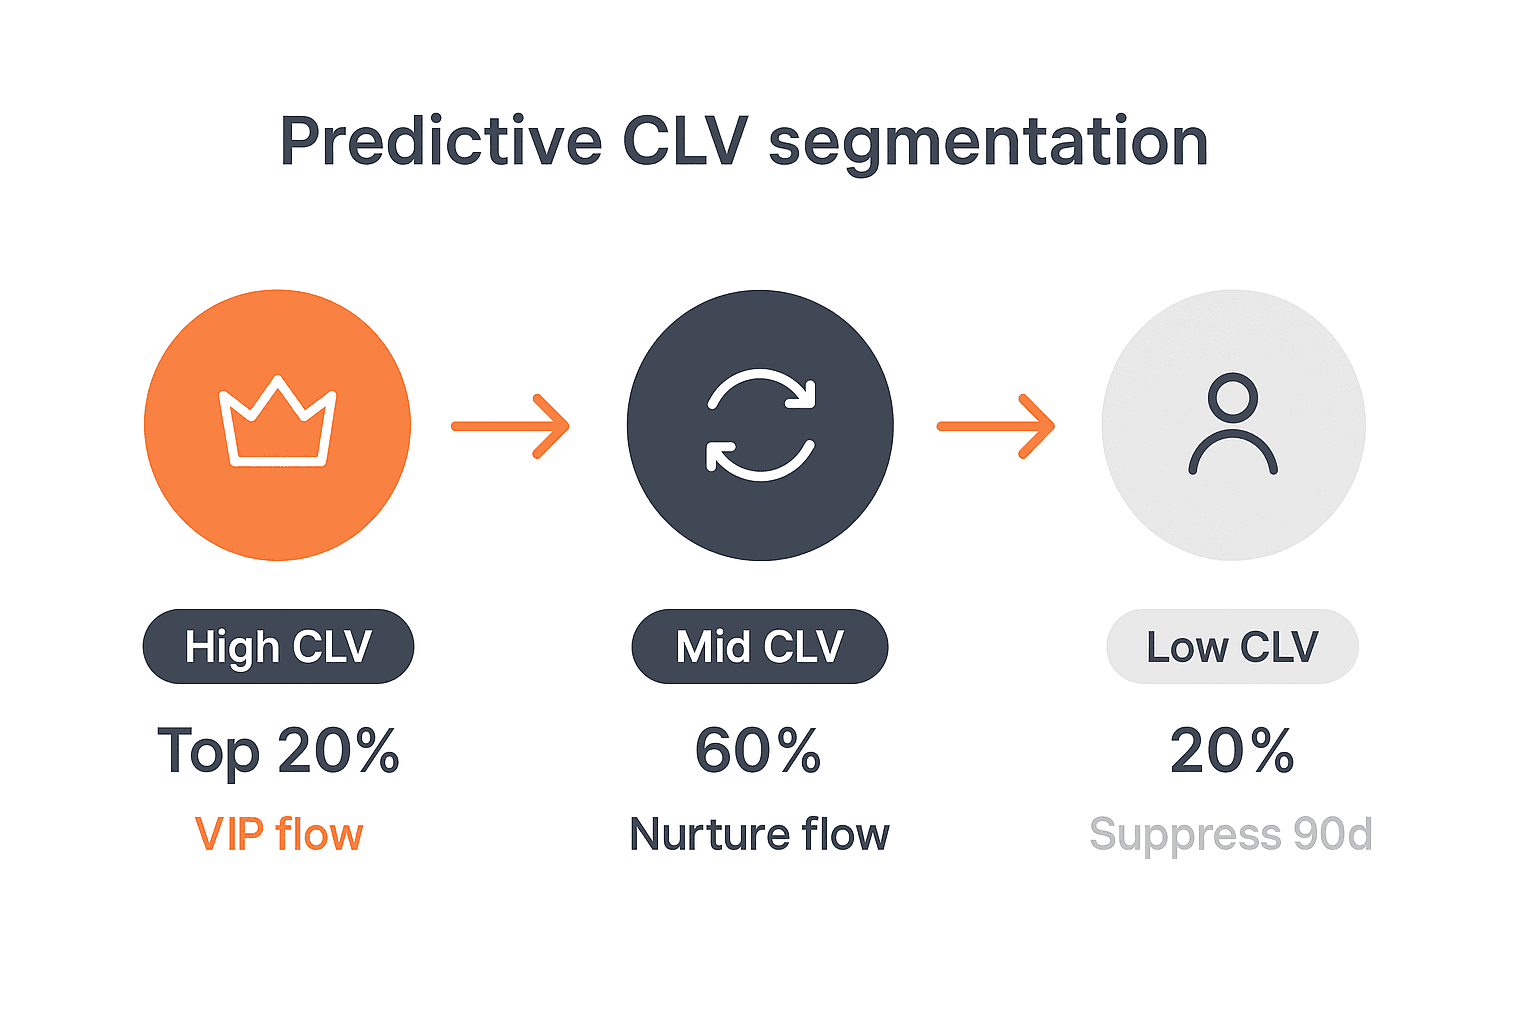
Klaviyo’s predictive analytics scores every customer in your list on predicted lifetime value before their second purchase. This gives you three actionable segments:
High predicted CLV (top 20%) — These customers are likely to become repeat buyers regardless of what you do. The goal is to accelerate their second purchase (within 14 days of the first) and move them to VIP status. Don’t give these customers discounts — they don’t need them. Give them early access, exclusive drops, and personal touches.
Mid predicted CLV (middle 60%) — This is your conversion opportunity. A 5% improvement in converting mid-CLV customers to repeat buyers typically adds 12-18% to annual revenue. The lever is a post-purchase nurture sequence: 3-4 emails over 21 days surfacing complementary products and social proof.
Low predicted CLV (bottom 20%) — These customers are likely to be one-and-done. Don’t invest retention spend here. Suppress them from win-back flows after 90 days and focus resources on the segments above.
Automate retention by segment
Once segments are defined, Klaviyo Flows automates the actions:
- High CLV → VIP flow (early access emails, personal thank you, exclusive offer)
- Mid CLV → Post-purchase nurture (product education, upsell, social proof)
- At-risk customers (no purchase in 60-90 days) → Win-back flow (re-engagement + offer)
- Low CLV, 120+ days inactive → Suppression (remove from active sends, save send credits)
The automation runs 24/7. The only ongoing task is reviewing the CLV scoring monthly and adjusting segment thresholds as your customer base grows.
→ Full Klaviyo flow setup guide: Shopify Klaviyo flows setup
Track repeat purchase rate as your north star
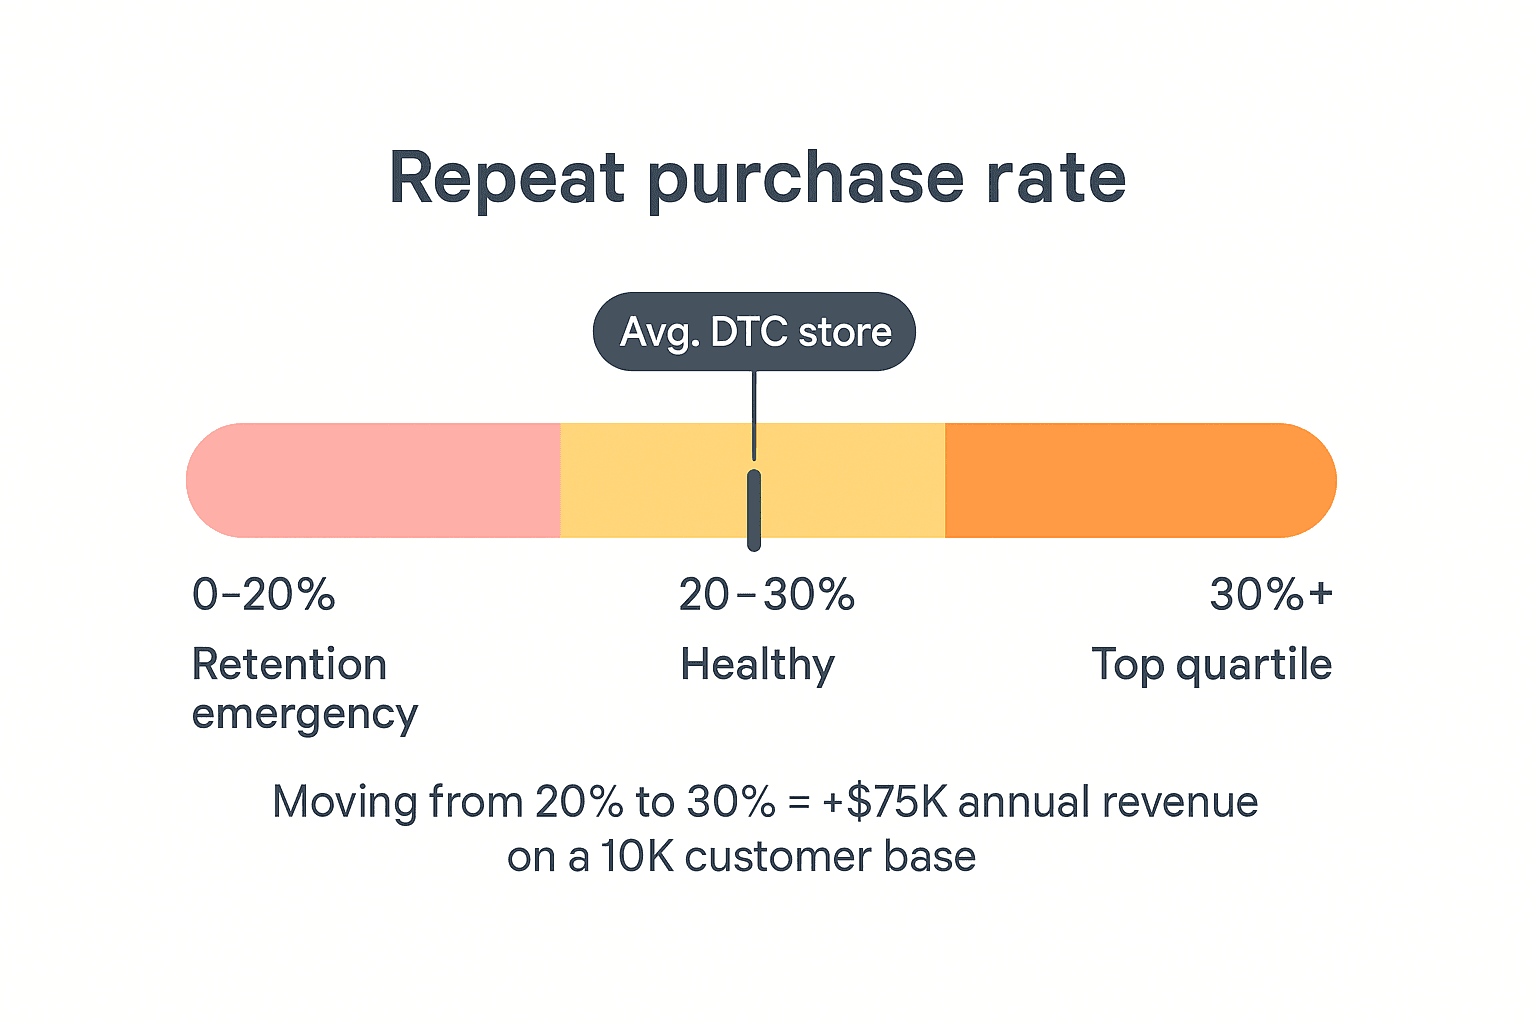
The metric that ties CAC and LTV together is repeat purchase rate: the share of customers who buy more than once within 12 months.
Benchmarks for this vary widely by category and price point, so compare your store with itself. Track your 12-month repeat purchase rate every quarter and watch the direction it moves.
Here’s how the math works, as a simple illustration. At a $75 average order value, moving from a 20% to a 30% repeat purchase rate on a 10,000-customer base adds $75,000 in annual revenue, with no new customers. Predictive segments and automated retention flows are the tools aimed at that number. Measure your own rate before and after you add them.
The tool stack for AI analytics
| Tool | Function | Monthly cost | Affiliate |
|---|---|---|---|
| Triple Whale | First-party attribution, Moby AI analysis, creative analytics | $149/month | ✅ 20% recurring |
| Klaviyo | Predictive CLV scoring, customer segmentation, retention flows | From $45/month | ✅ 15% × 12 months |
| Shopify Analytics | Baseline revenue and traffic data | Free | — |
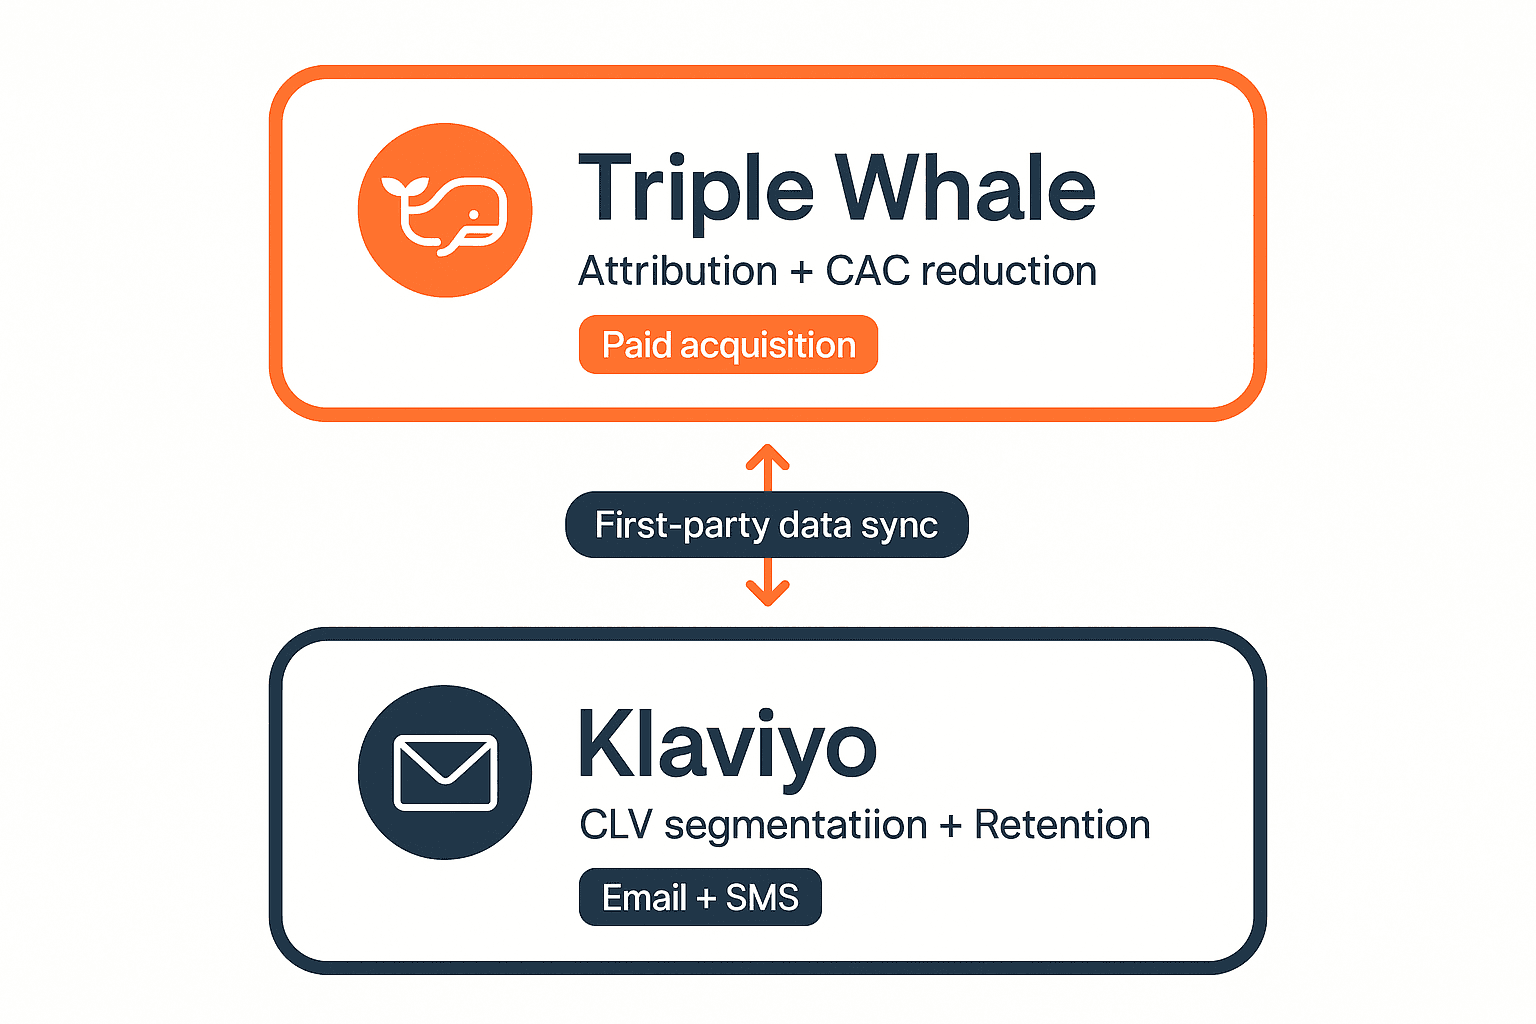
Triple Whale covers the acquisition side: true ROAS, channel attribution, and creative performance. It shows where your CAC is leaking.
Klaviyo covers the retention side: who your best customers are, who’s about to churn, and what to send them. It’s where LTV gets built.
The two tools feed each other. Triple Whale’s data shows which channels bring your highest-CLV customers, not just the most customers. That sharpens your ad targeting and improves the quality of what you pay to acquire over time.
→ Start with Triple Whale for attribution: Triple Whale
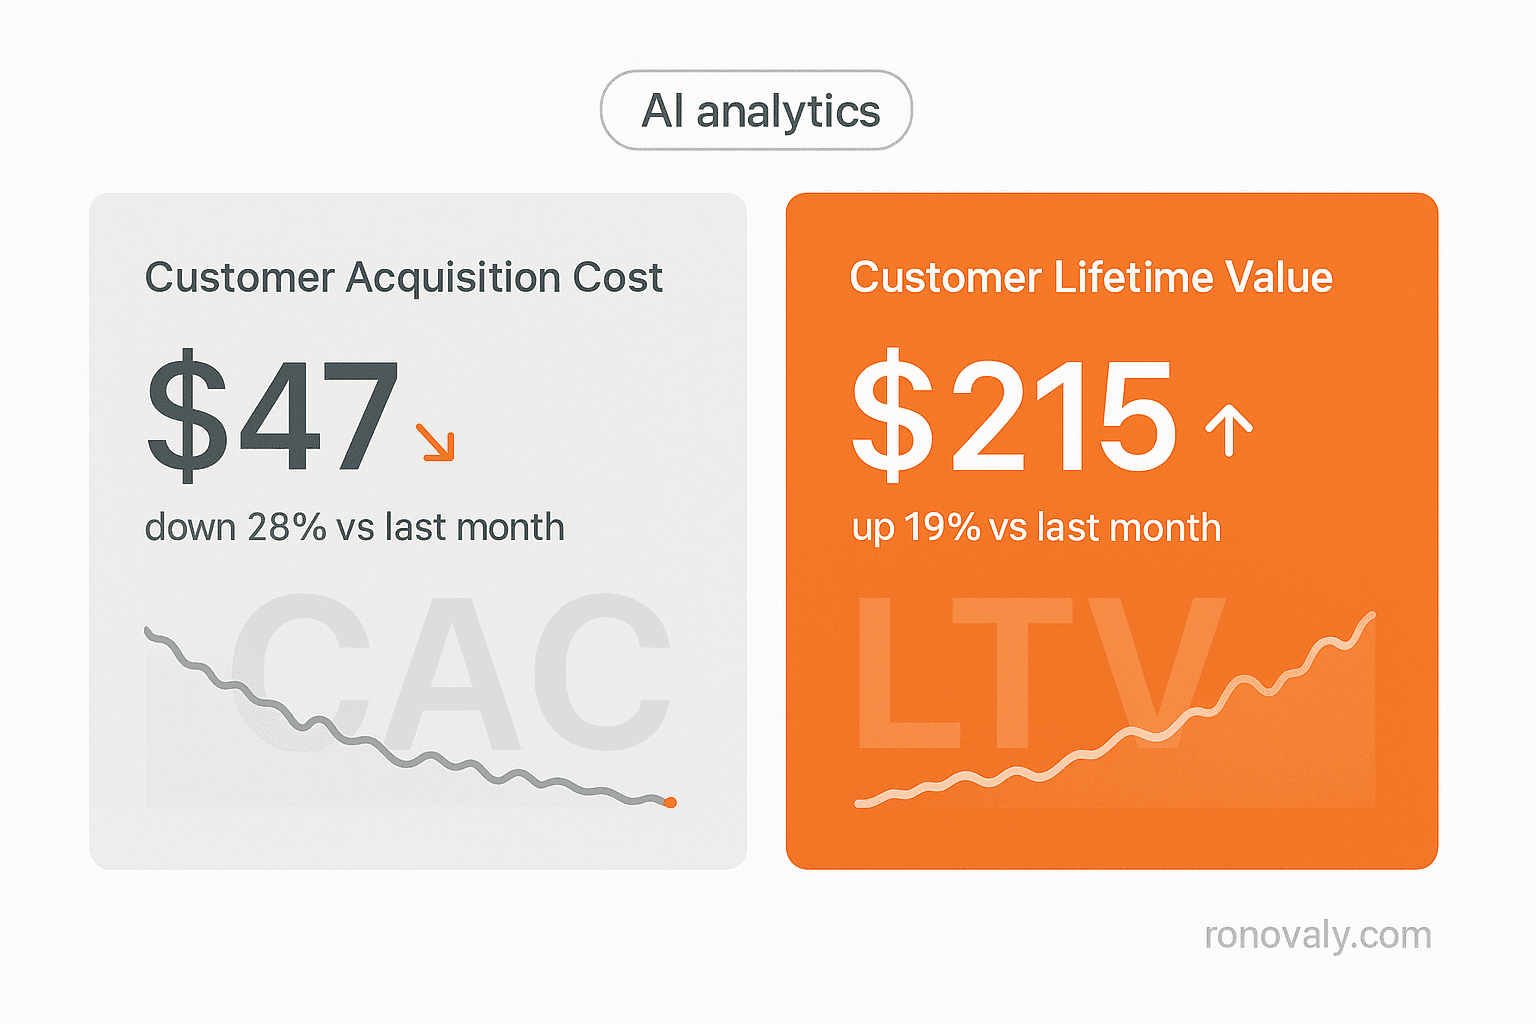
CAC and LTV work together. Better attribution lowers CAC by moving budget to channels that truly perform. Predictive CLV segments raise LTV by focusing retention on the customers most likely to buy again. Together, they improve the CAC:LTV ratio, the core profit metric for repeat-purchase DTC brands. The key point: AI analytics doesn’t just report performance. It changes the decisions that drive it.
Frequently asked questions
What’s the difference between Shopify Analytics and Triple Whale?
Shopify Analytics shows revenue, orders, traffic, and conversion rate: what happened. Triple Whale shows which marketing channel drove each sale. It uses first-party data to work around the gaps from iOS 14+, ad blockers, and cross-device journeys. At low ad spend, Shopify Analytics is usually enough. As spend grows, weigh the cost of misdirected budget against Triple Whale’s subscription fee.
How long does it take to see CAC improvements after installing Triple Whale?
Once the pixel is installed, attribution data builds up over the first few weeks. Wait until you have enough data to be confident before you move budget. Then judge the effect on CAC over the following months, as the moved spend starts to perform.
Is Klaviyo’s predictive CLV accurate for small stores?
Klaviyo’s predictive models need enough data to work: Klaviyo’s documented threshold is at least 500 customers who have placed an order and at least 180 days of order history. For smaller stores, use RFM segments instead (recency, frequency, monetary value). They’re rule-based and work at any list size. Klaviyo supports both.
What’s a realistic LTV improvement in the first year?
How much LTV you gain from predictive segments and automated flows varies a lot by category, AOV, and how often people buy. The gains usually come from three places: finding high-value customers sooner, win-back flows that bring lapsed customers back, and post-purchase flows that raise repeat purchases. Record your 12-month LTV before you start so you can measure the real change.
Should I implement attribution first or retention first?
Attribution first. Knowing where your customers really come from lets you improve both CAC (by moving budget) and LTV (by finding which channels bring your best customers). Retention work pays off more once you’re attracting the right customers. A typical order: Triple Whale in month 1, then Klaviyo predictive segments in month 2, then full automation in month 3.
The bottom line
CAC and LTV aren’t separate metrics. They’re two sides of the same profit equation. First-party attribution stops wasted ad spend, and predictive segments focus retention where it compounds. Brands that use both can improve both numbers at once.
The tools cost a few hundred dollars a month. Whether they pay off depends on how much ad spend you can redirect and how much your repeat purchase rate moves. Track both from day one.
→ For the full framework connecting analytics to every major Shopify decision, read the AI decision making guide for Shopify founders
Written by Sarah Blake — E-commerce & Growth at Ronovaly. Sarah covers AI-driven strategy and conversion optimization for US-based DTC brands and Shopify sellers.
Analytics is one input — for the full picture: AI-driven decision making for Shopify DTC founders. For the operational side of the same data — stock levels instead of ad spend — see AI inventory forecasting for Shopify.
This post contains affiliate links. If you make a purchase through these links, we may earn a commission at no extra cost to you.