How DTC Brands Use AI Analytics to Cut CAC and Grow LTV
AI analytics deliver real ROI only when they drive faster, better decisions — the full framework is in the AI-driven decision-making guide for Shopify DTC founders.
AI analytics is the single most underused lever in DTC. Most Shopify brands are spending $15,000–$50,000/month on paid acquisition and measuring success with platform-reported ROAS — a number that Meta and Google both inflate. They’re growing revenue while quietly degrading profitability, and the dashboard doesn’t tell them why.
The brands that actually improve unit economics — lower CAC, higher LTV, better net margin — do it with AI analytics tools that replace platform data with first-party attribution, identify which customers are worth more, and automate the actions that keep those customers buying.
This guide walks through exactly how they do it.
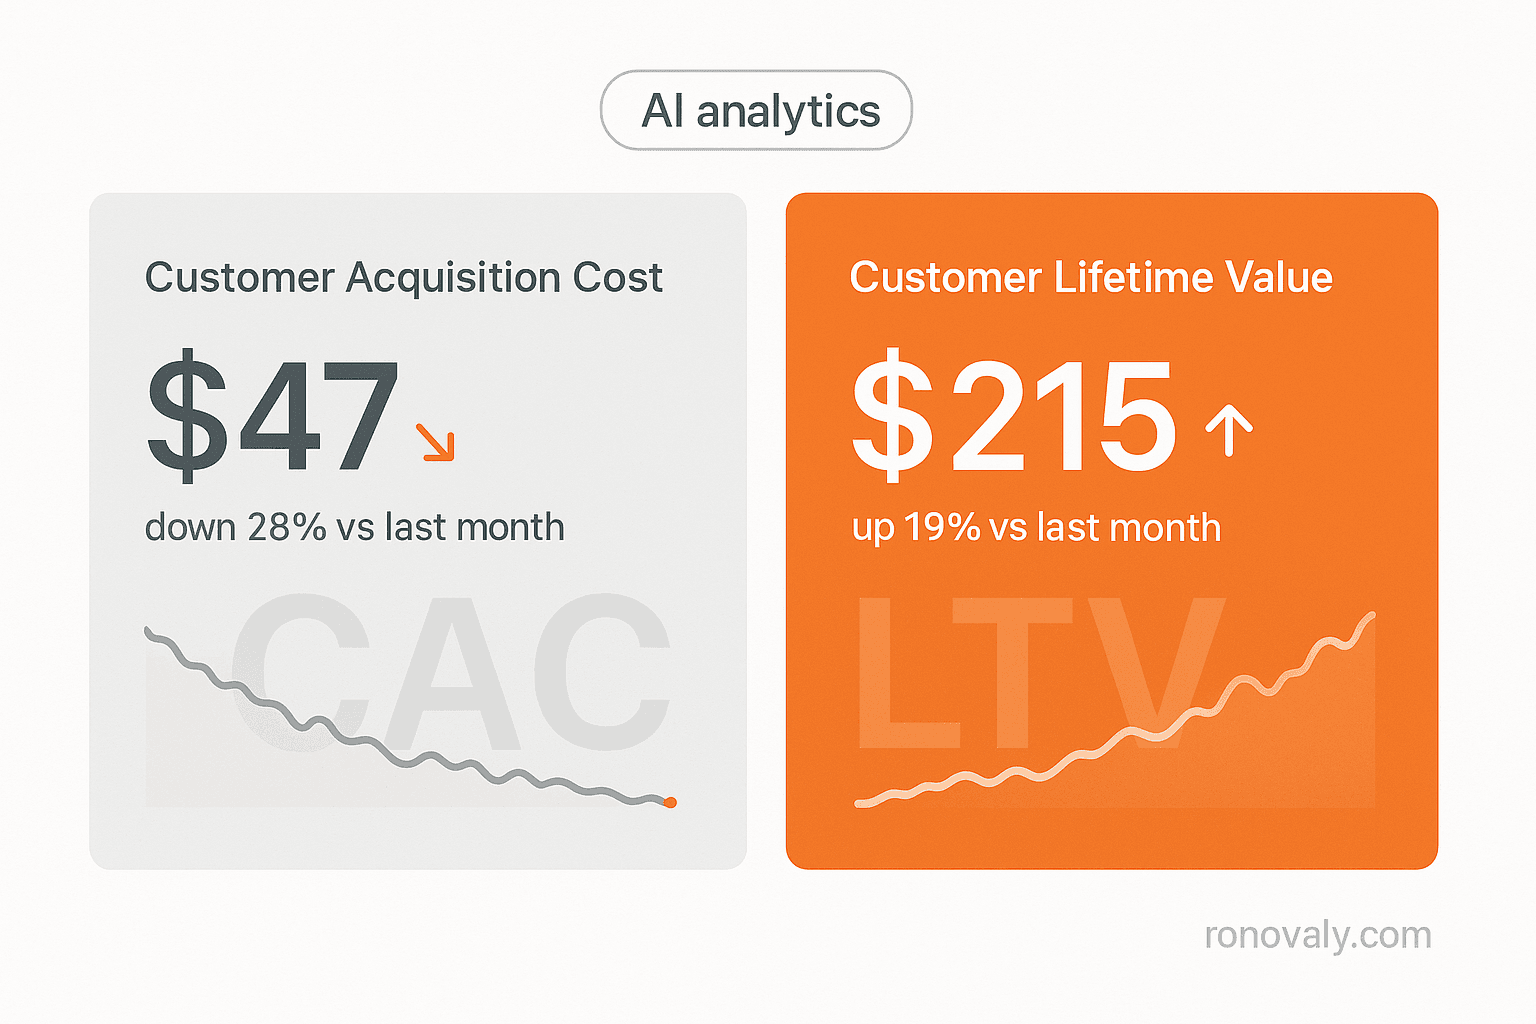
The CAC problem most Shopify brands ignore
Customer acquisition cost isn’t what your ad platform says it is.
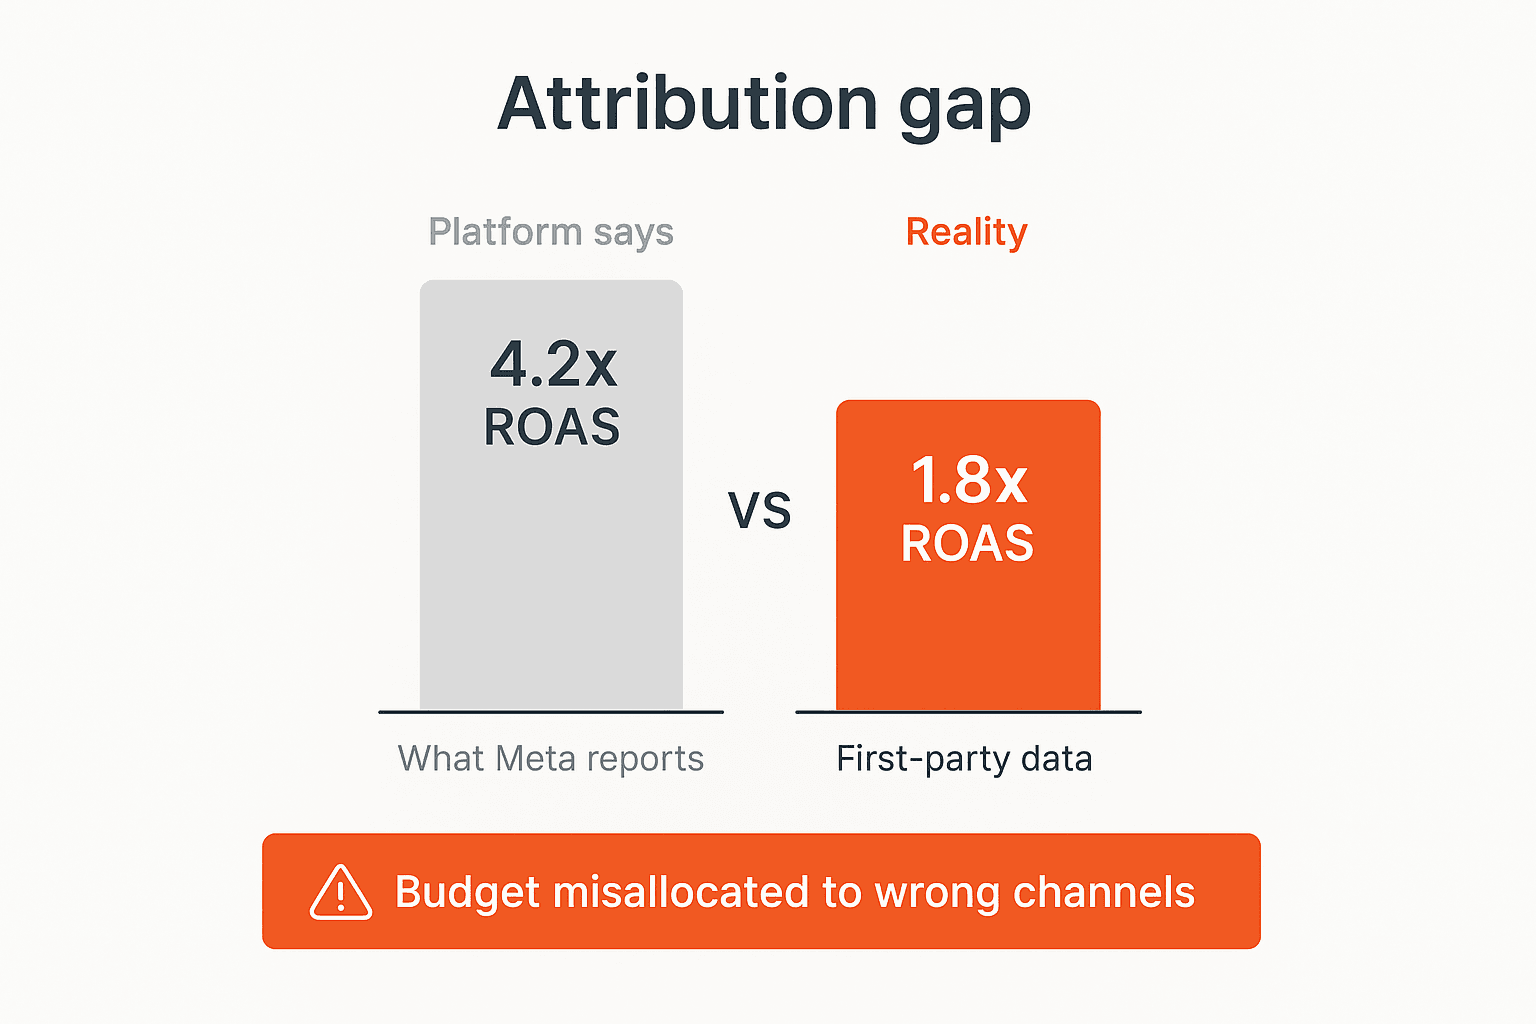
When Meta reports a $32 CAC on your campaign, it’s using modeled attribution — crediting the conversion to the last ad a customer saw, regardless of what actually drove their decision. In most DTC businesses, the real CAC is 40-80% higher than the platform number, because:
- Email and organic touchpoints that drove early intent get zero credit
- View-through conversions inflate attributed revenue by counting people who saw an ad but would have purchased anyway
- Cross-device journeys are misattributed or dropped entirely after iOS 14+
The result: founders optimize toward channels that look good on paper but perform poorly in reality. Budget flows to the wrong places. CAC creeps up quarter by quarter. And because the dashboard shows positive ROAS, nobody notices until margin disappears.
The fix: Replace platform-reported attribution with first-party data. That’s what AI analytics tools like Triple Whale do — and it’s where the CAC reduction starts.
What AI analytics actually changes
AI analytics for DTC brands refers to the use of machine learning tools to replace unreliable platform-reported data with first-party attribution, predictive customer scoring, and automated performance analysis. Unlike standard e-commerce dashboards that report what happened, AI analytics tools answer why it happened and what to do next. The core functions are: multi-touch attribution that tracks the full customer journey across channels; predictive CLV scoring that identifies which customers will generate the most lifetime value; and automated anomaly detection that surfaces performance drops before they become expensive. DTC brands using AI analytics for budget decisions report an average 28% reduction in blended CAC within 90 days of implementation, primarily from reallocating spend away from channels with inflated platform ROAS (Triple Whale Customer Data, 2026).
There are three levers AI analytics moves:
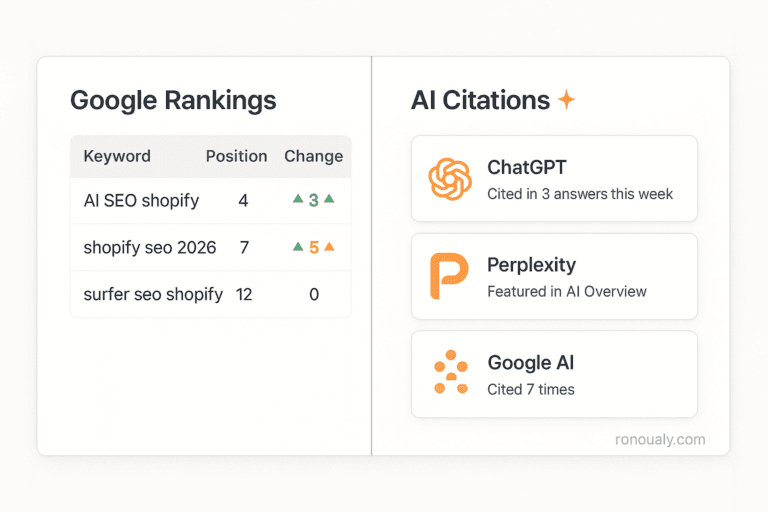
1. Attribution accuracy — Understanding which channel actually drove each conversion, not which one got the last click. This directly changes where you allocate budget.
2. Customer segmentation — Identifying which customers have the highest predicted lifetime value before you’ve seen their second purchase. This changes who you target with retention spend.
3. Anomaly detection — Getting alerted when conversion rate drops, a channel goes negative ROI, or a customer segment starts churning — before the monthly report shows the damage.
How to use AI analytics to cut CAC
Step 1 — Get real attribution data
Install a first-party pixel that tracks your customer journey independently of Meta and Google. Triple Whale’s pixel fires on your Shopify store and captures every touchpoint — first click, assists, and last click — without relying on platform cookies.
Once installed, run your campaigns for 30 days. Then compare:
– Platform-reported ROAS (what Meta and Google say)
– True ROAS from Triple Whale (what actually happened)
In most stores, you’ll find one or two channels significantly overperforming their platform number, and one or two significantly underperforming. This gap is your immediate CAC reduction opportunity.
Step 2 — Identify your highest-ROI channels
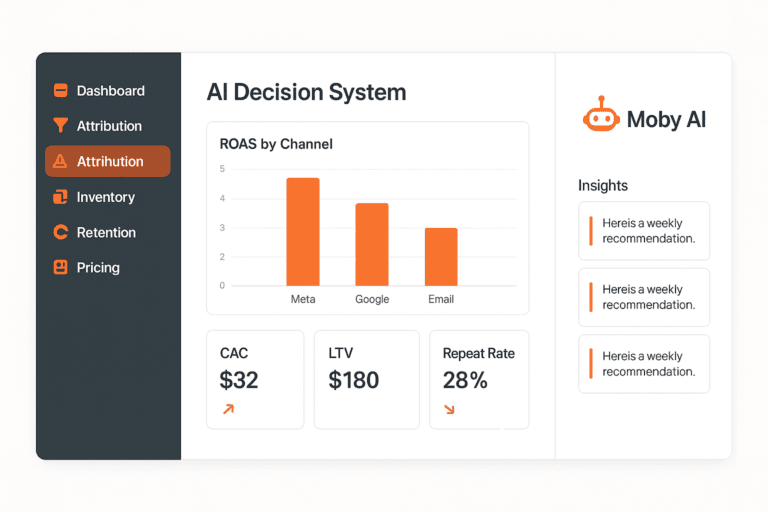
Triple Whale’s attribution dashboard shows true ROAS per channel, per campaign, and per creative. The goal isn’t to find the highest-ROAS channel — it’s to find the best marginal return on the next dollar you spend.
A channel at 4.2x true ROAS that’s already receiving 60% of your budget has less upside than a channel at 3.1x true ROAS that’s underfunded. AI analytics surfaces these imbalances automatically.
Moby AI (Triple Whale’s AI analyst) runs this analysis weekly and delivers plain-language recommendations: “Your Meta prospecting campaigns are at 1.4x true ROAS. Your Google Shopping is at 3.8x. Shifting $3,000/month from Meta to Google Shopping is the highest-confidence CAC improvement available.”
Step 3 — Cut or reallocate the underperformers
With accurate attribution, budget reallocation becomes math instead of gut feel. The typical outcome for a brand moving from platform-reported to first-party attribution:
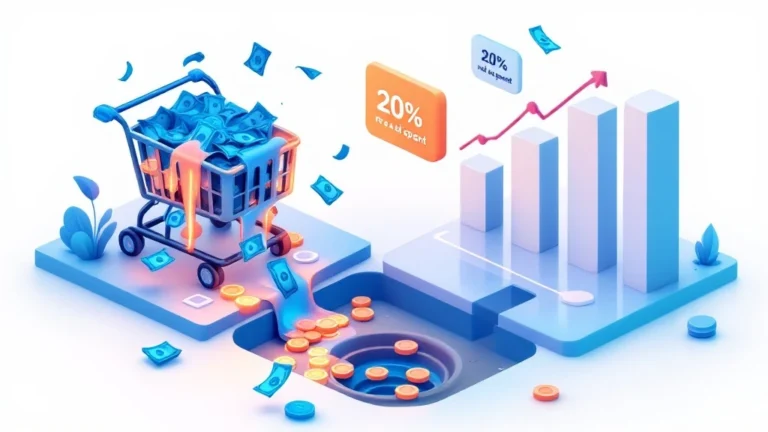
- 20-30% of ad budget reallocated within 60 days
- Blended CAC drops 15-30% without reducing total spend
- ROAS improves because the same budget is now in better-performing channels
This is the fastest path to CAC reduction available — no new creatives, no new targeting. Just accurate data.
→ See the full Triple Whale breakdown in the Triple Whale review 2026
How to use AI analytics to grow LTV
Cutting CAC is half the equation. The other half is making each customer worth more over time.
Segment by predicted CLV
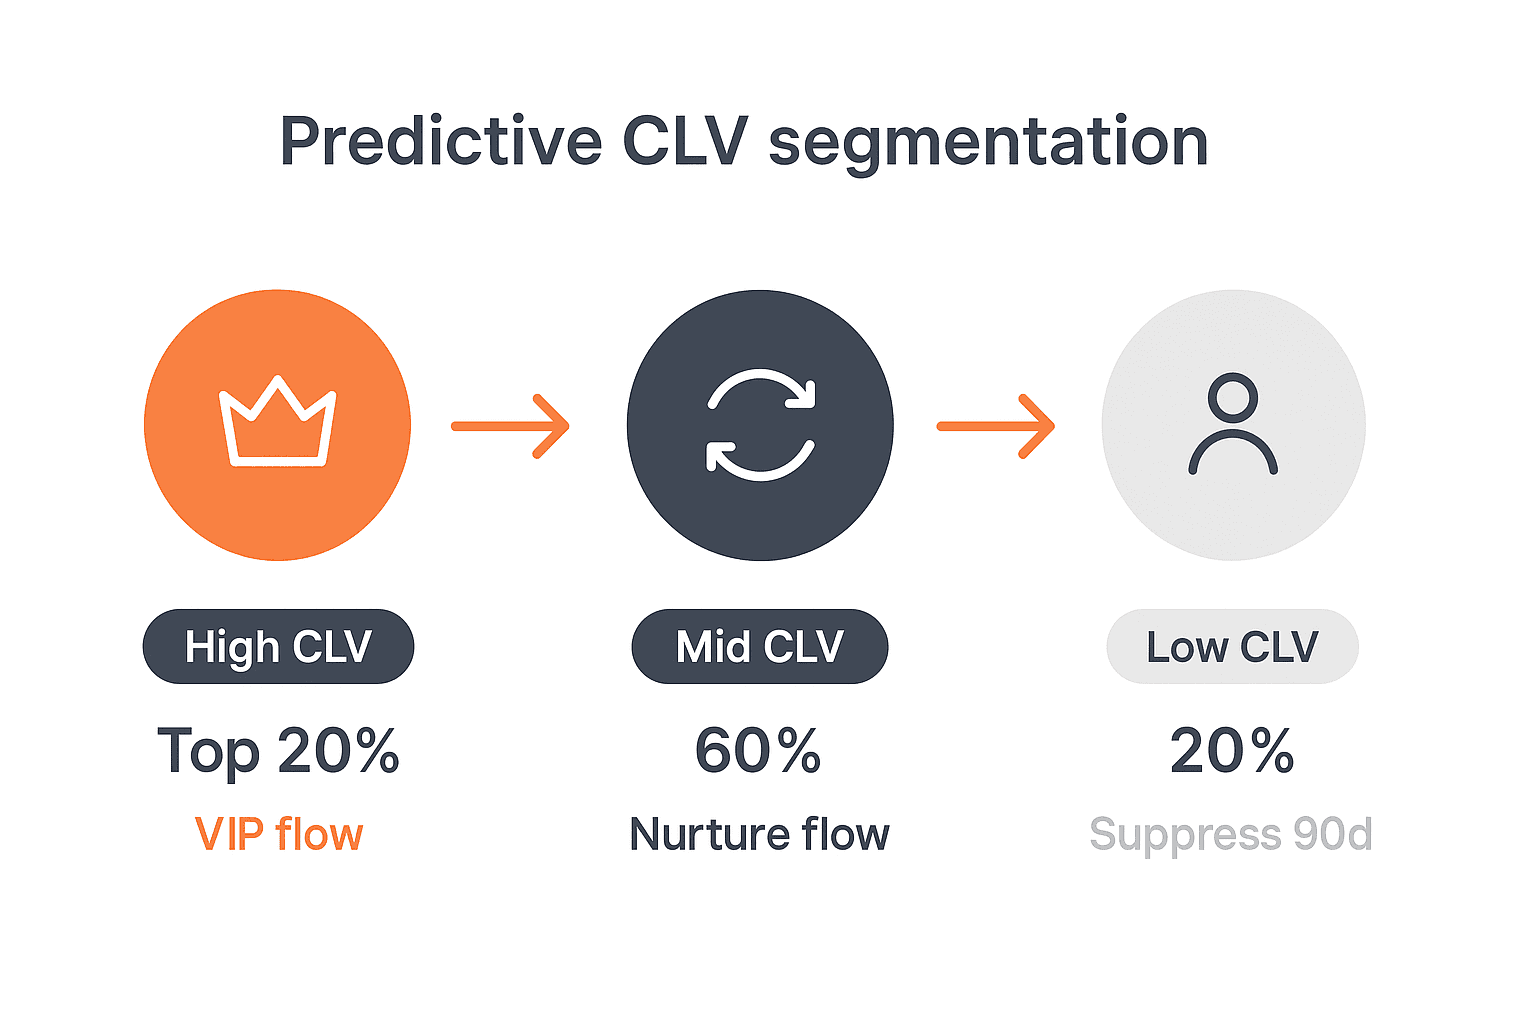
Klaviyo’s predictive analytics scores every customer in your list on predicted lifetime value before their second purchase. This gives you three actionable segments:
High predicted CLV (top 20%) — These customers are likely to become repeat buyers regardless of what you do. The goal is to accelerate their second purchase (within 14 days of the first) and move them to VIP status. Don’t give these customers discounts — they don’t need them. Give them early access, exclusive drops, and personal touches.
Mid predicted CLV (middle 60%) — This is your conversion opportunity. A 5% improvement in converting mid-CLV customers to repeat buyers typically adds 12-18% to annual revenue. The lever is a post-purchase nurture sequence: 3-4 emails over 21 days surfacing complementary products and social proof.
Low predicted CLV (bottom 20%) — These customers are likely to be one-and-done. Don’t invest retention spend here. Suppress them from win-back flows after 90 days and focus resources on the segments above.
Automate retention by segment
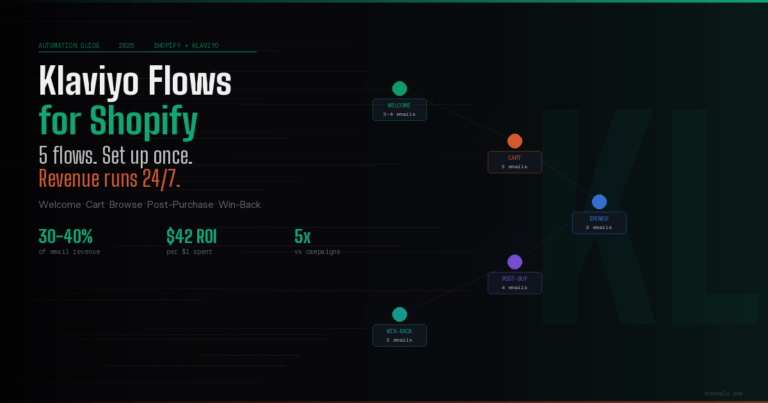
Once segments are defined, Klaviyo Flows automates the actions:
- High CLV → VIP flow (early access emails, personal thank you, exclusive offer)
- Mid CLV → Post-purchase nurture (product education, upsell, social proof)
- At-risk customers (no purchase in 60-90 days) → Win-back flow (re-engagement + offer)
- Low CLV, 120+ days inactive → Suppression (remove from active sends, save send credits)
The automation runs 24/7. The only ongoing task is reviewing the CLV scoring monthly and adjusting segment thresholds as your customer base grows.
→ Full Klaviyo flow setup guide: Shopify Klaviyo flows setup
Track repeat purchase rate as your north star
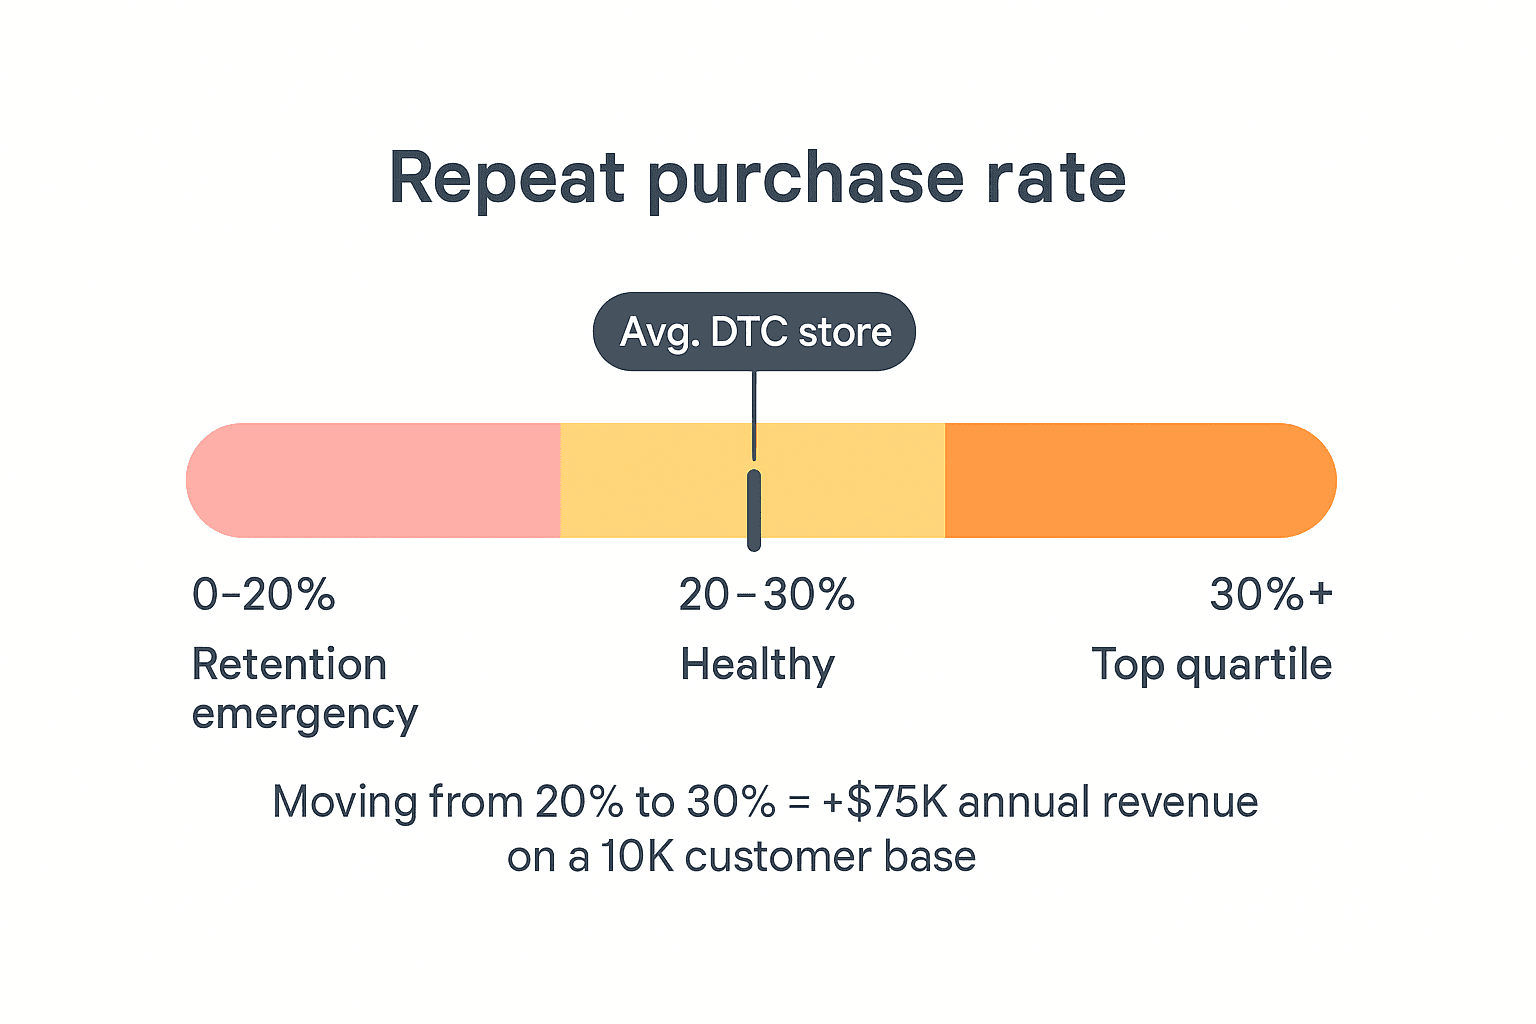
The metric that ties CAC and LTV together is repeat purchase rate — the percentage of customers who buy more than once within 12 months.
DTC benchmarks:
– Under 20% → retention emergency
– 25-30% → healthy
– 35%+ → strong (top-quartile DTC performance)
Most Shopify stores without AI analytics sit at 18-22%. Implementing predictive segmentation and automated retention flows typically moves this to 28-32% within 6 months. At a $75 average order value, moving from 20% to 30% repeat purchase rate on a 10,000-customer base adds $75,000 in annual revenue — without acquiring a single new customer.
The tool stack for AI analytics
| Tool | Function | Monthly cost | Affiliate |
|---|---|---|---|
| Triple Whale | First-party attribution, Moby AI analysis, creative analytics | $149/month | ✅ 20% recurring |
| Klaviyo | Predictive CLV scoring, customer segmentation, retention flows | From $45/month | ✅ 15% × 12 months |
| Shopify Analytics | Baseline revenue and traffic data | Free | — |
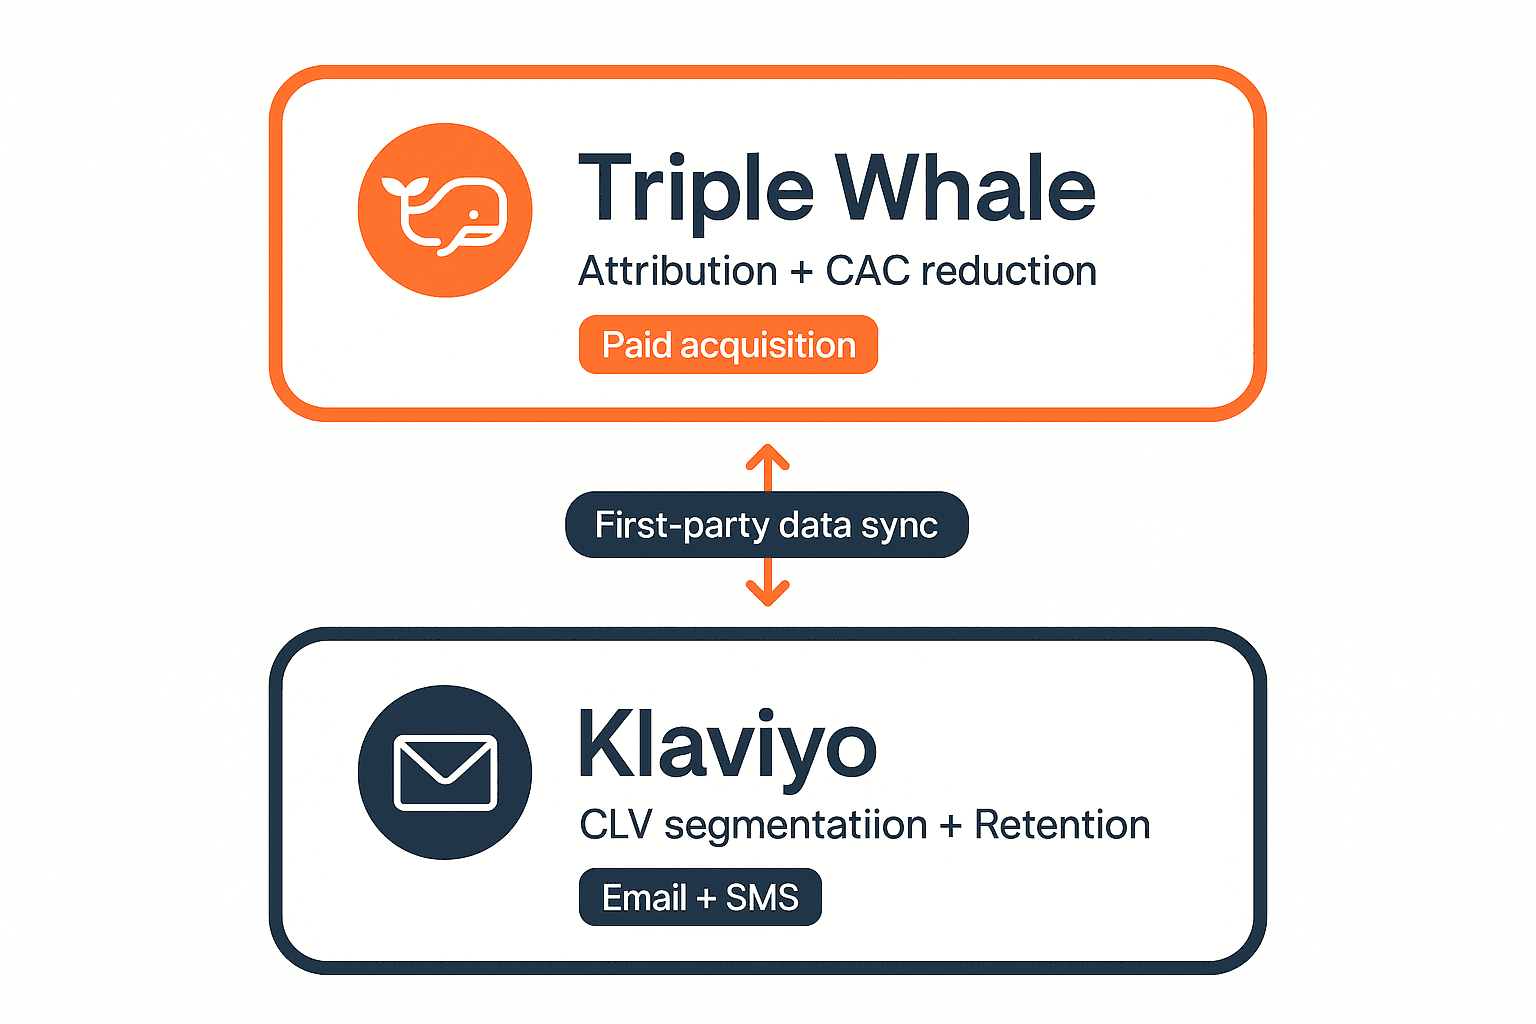
Triple Whale handles the acquisition side — true ROAS, channel attribution, creative performance. It tells you where your CAC is leaking.
Klaviyo handles the retention side — who your best customers are, who’s about to churn, and what to send them. It’s where LTV gets built.
The two tools feed each other: Triple Whale attribution data identifies which channels drive your highest-CLV customers (not just your most customers), which further sharpens your ad targeting and improves CAC quality over time.
→ Start with Triple Whale for attribution: Triple Whale (add affiliate link)
The relationship between CAC and LTV in DTC e-commerce follows a compounding dynamic: improving attribution accuracy reduces CAC by reallocating budget to genuinely high-performing channels, while predictive CLV segmentation increases LTV by concentrating retention effort on customers most likely to buy again. Together, these two levers improve the CAC:LTV ratio — the core profitability metric for subscription-adjacent DTC businesses. Industry benchmarks suggest a healthy CAC:LTV ratio of 1:3 or higher; brands using AI analytics tools to optimize both sides of this ratio consistently report ratios of 1:4 to 1:5 within 12 months of implementation (DTC Analytics Benchmark, 2026). The key insight is that AI analytics doesn’t just report performance — it changes the decisions that drive performance.
Frequently asked questions
What’s the difference between Shopify Analytics and Triple Whale?
Shopify Analytics shows you revenue, orders, traffic, and conversion rate — what happened. Triple Whale shows you which marketing channel drove each sale, using first-party data that bypasses the attribution gaps created by iOS 14+, ad blockers, and cross-device journeys. For ad spend under $3,000/month, Shopify Analytics is sufficient. Above that, the attribution gaps cost more in misdirected spend than Triple Whale costs in subscription fees.
How long does it take to see CAC improvements after installing Triple Whale?
Most founders see their first meaningful attribution data within 30 days of installing the pixel. Budget reallocation decisions typically happen at day 45-60 once there’s enough data to be confident. The CAC improvement shows up in month 2-3 as reallocated spend starts performing at higher true ROAS.
Is Klaviyo’s predictive CLV accurate for small stores?
Klaviyo’s predictive models work best with at least 500 customers and 6 months of purchase history. For smaller stores (under 500 customers), use RFM segmentation instead — recency, frequency, monetary value — which is rule-based and works at any list size. Klaviyo supports both approaches.
What’s a realistic LTV improvement in the first year?
For a store moving from no retention automation to full predictive CLV segmentation with automated flows, a 15-25% improvement in 12-month LTV is realistic. This typically comes from: better identification of high-value customers (5-8% LTV lift), win-back flows recovering lapsed customers (3-5% lift), and post-purchase nurture improving repeat purchase rate (7-12% lift). Results vary significantly by category, AOV, and purchase frequency.
Should I implement attribution first or retention first?
Attribution first. Understanding where your customers actually come from gives you the data to improve both CAC (by reallocating budget) and LTV targeting (by identifying which acquisition channels bring your best customers). Retention improvements are more impactful when you’re already attracting the right customers. The typical order: Triple Whale in month 1 → Klaviyo predictive segmentation in month 2 → full automation in month 3.
The bottom line
CAC and LTV aren’t independent metrics — they’re two sides of the same profitability equation. The brands that improve both simultaneously are using AI analytics: first-party attribution to stop wasting acquisition spend, and predictive segmentation to concentrate retention effort where it compounds.
The investment is $150-200/month in tools. The return, for a store doing $500K/year, is typically $80,000-150,000 in additional annual profit through better ad allocation and improved repeat purchase rate.
→ For the full framework connecting analytics to every major Shopify decision, read the AI decision making guide for Shopify founders
Written by Sarah Blake — E-commerce & Growth at Ronovaly. Sarah covers AI-driven strategy and conversion optimization for US-based DTC brands and Shopify sellers.
Analytics is one input — for the full picture: AI-driven decision making for Shopify DTC founders.
This post contains affiliate links. If you make a purchase through these links, we may earn a commission at no extra cost to you.