AI Demand Forecasting Accuracy Shopify: What to Expect
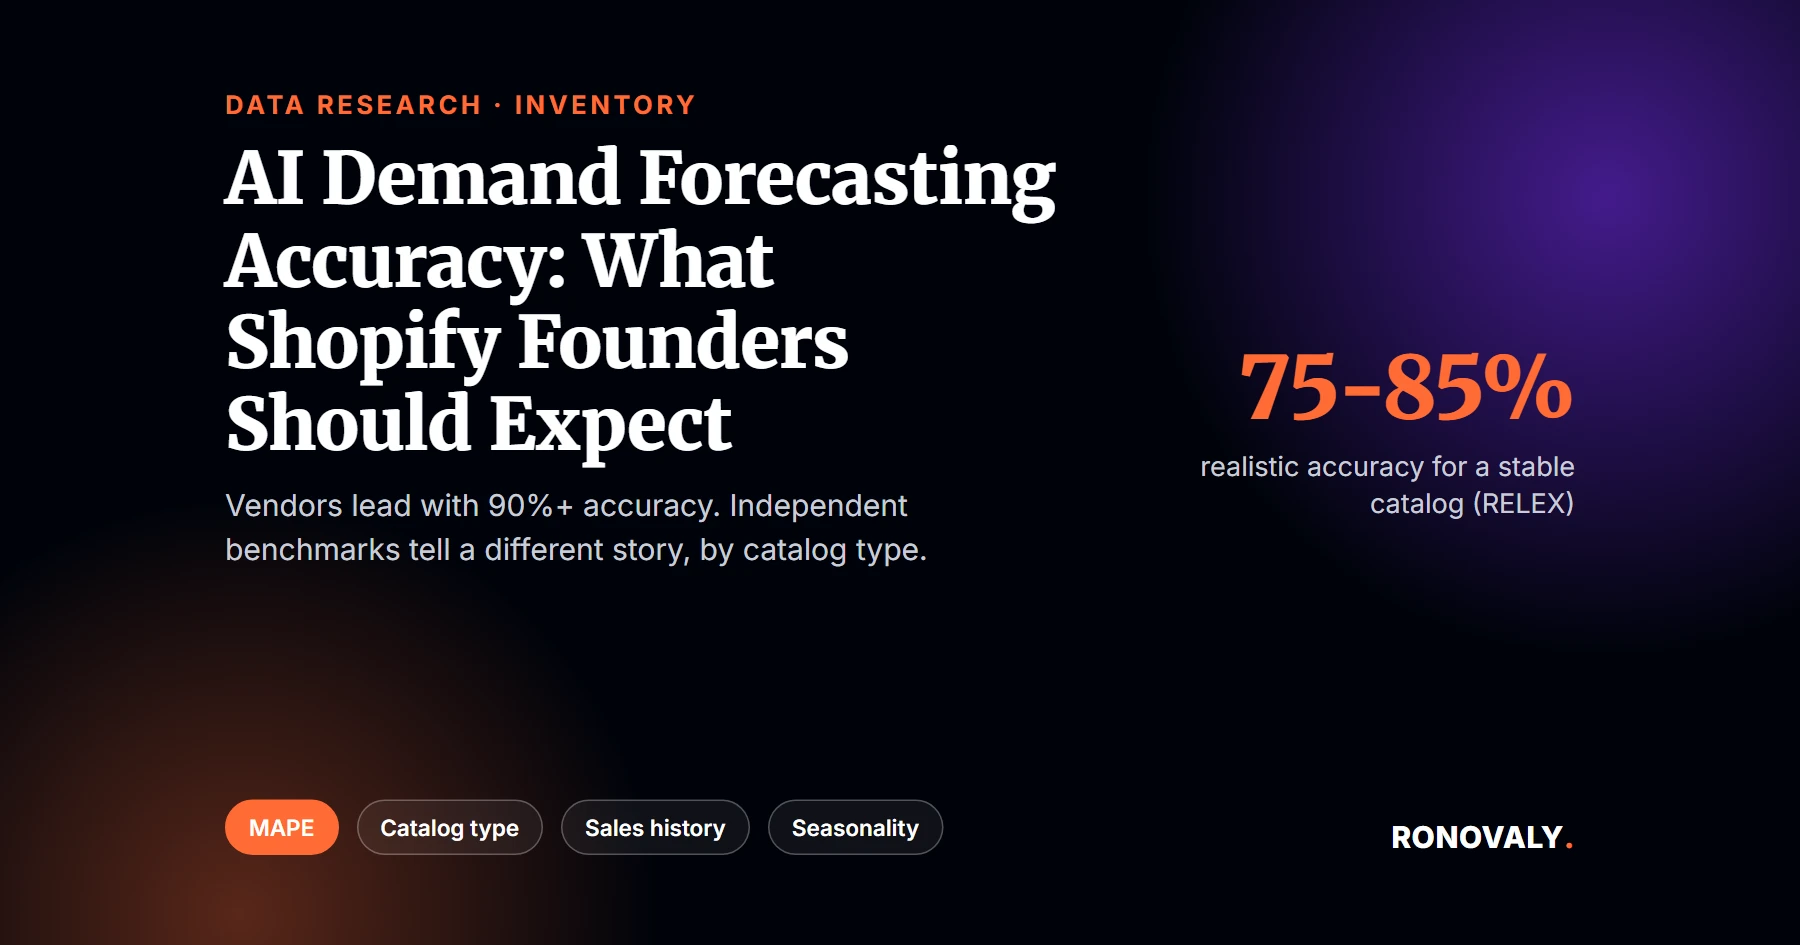
AI demand forecasting accuracy Shopify vendors advertise rarely matches independent data. Realistic accuracy runs about 75 to 85 percent on a stable, low-season catalog. It drops to 35 to 60 percent MAPE on a fashion or launch-heavy catalog. Both numbers come from real benchmarks, not vendor ads. In fact, your own result hinges more on catalog type, sales history, and demand swings than on which tool you buy.
Search ai demand forecasting accuracy shopify and you’ll mostly find vendor pages promising 90 percent-plus results. Few explain what that number means for your catalog. One tool claims about 95 percent accuracy. Another just says its forecasts are “very high,” with no percentage at all. Notably, neither one tells you what happens once your catalog has a new seasonal drop, a slow-moving SKU, or six thin months of sales history instead of two full years.
Forecasting accuracy claims are some of the hardest to pin down, so I went through the vendor claims side by side with the independent benchmark data behind them. This is not a first-hand test of one store’s forecast. A fair accuracy test needs more history than any single case study could show. Instead, this is an honest read of what the accuracy claims are actually built on, plus a table you can use to set realistic expectations for your own catalog. If you haven’t set up AI forecasting yet, start with my AI inventory forecasting setup guide first, then come back here to calibrate what the numbers will actually mean once it’s running.
Key Takeaways
- Prediko advertises roughly 95 percent forecast accuracy trained on more than 25 million SKUs. However, it publishes no MAPE band or baseline, so the number cannot be independently checked.
- By contrast, independent data from RELEX Solutions puts realistic accuracy for a stable, low-seasonality catalog at 75 to 85 percent, not the 90-plus percent figures vendors lead with.
- Fashion and seasonal-launch catalogs run far worse. In fact, supply-chain benchmark reference Umbrex puts typical error at 35 to 60 percent MAPE for that category.
- Meanwhile, McKinsey’s widely cited 20 to 50 percent error-reduction figure is a range tied to data quality and category, not a guaranteed result for any one store.
- Notably, a supply-chain analyst at Planster publicly retracted its own published industry benchmark table in 2026 because the numbers traced back to unsourced articles quoting each other.
What Do Vendors Actually Claim About Forecasting Accuracy?
Vendor accuracy claims for Shopify forecasting tools fall into two camps. Some publish a specific headline percentage with no supporting methodology. Others publish no number at all. Prediko, for example, states its forecasting engine reaches approximately 95 percent accuracy, trained on more than 25 million SKUs pulled from Shopify brands. That claim comes from the vendor’s own comparison of inventory forecasting tools (Prediko, “13 Best Inventory Forecasting Software & Tools for 2026”, checked 2026-09-04). That is the entire disclosure. There is no stated MAPE band, no baseline, and no breakdown by catalog type.
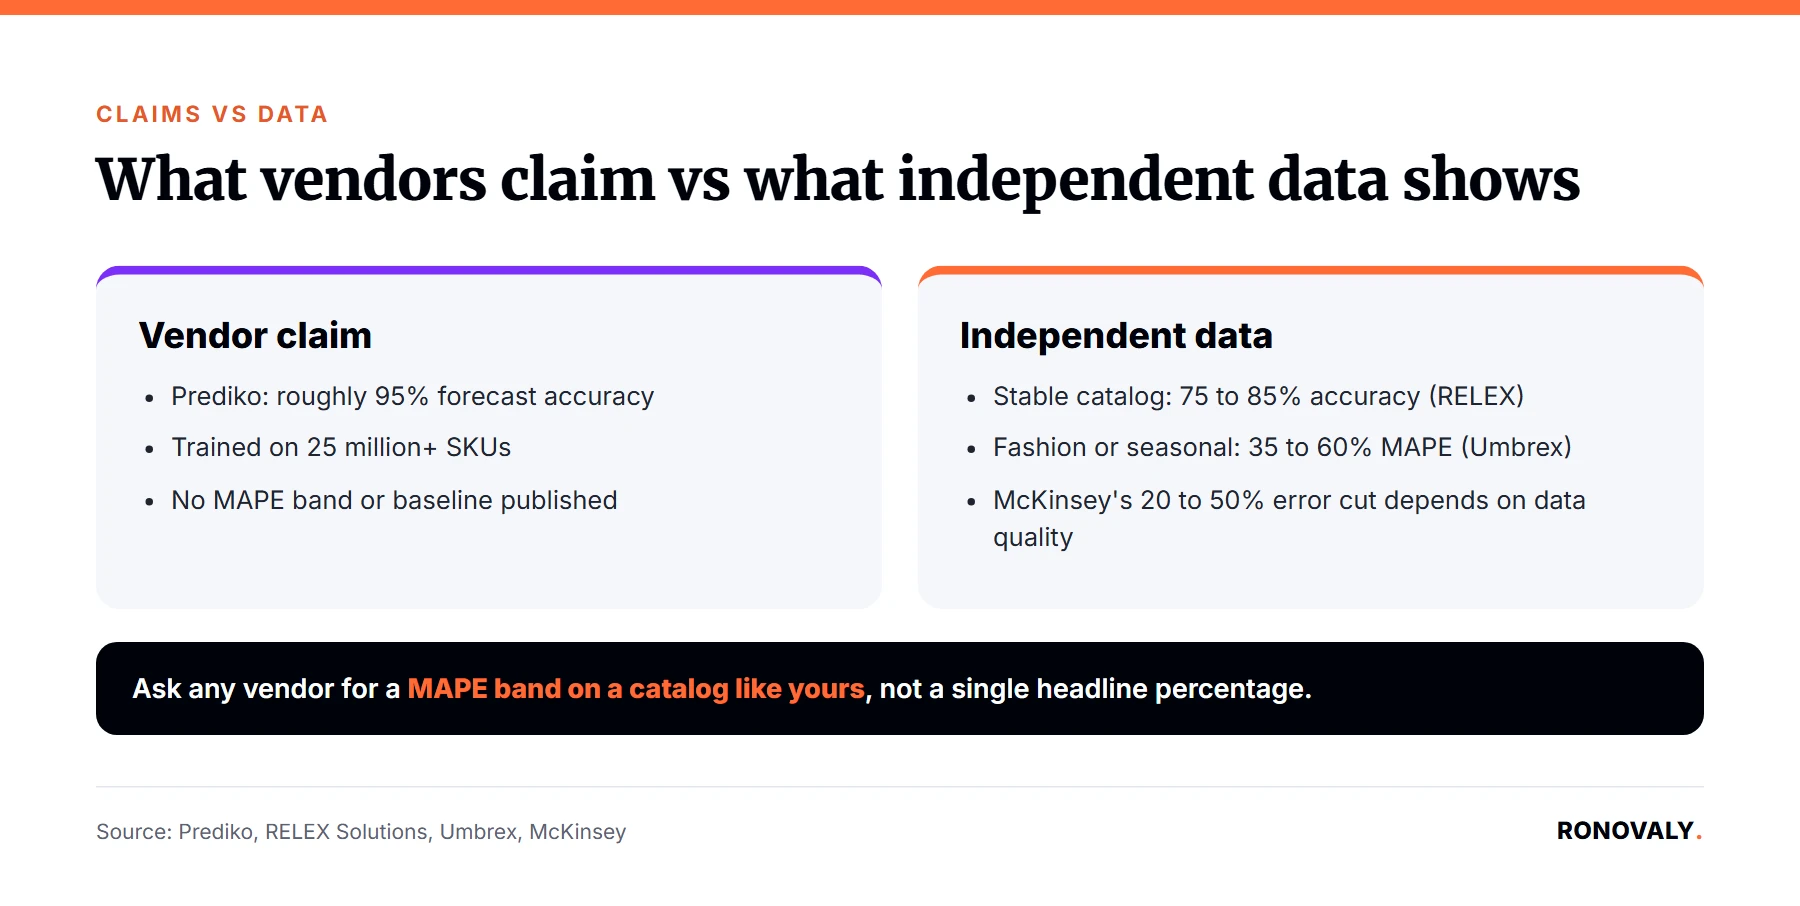
So why would most vendors skip a number entirely? Netstock, by contrast, describes its forecasting as “very high” accuracy, with no percentage anywhere on its solutions page. That description comes straight from the vendor’s own site (Netstock, “Stock and Inventory Forecasting Software”, checked 2026-09-04). Cogsy and Inventory Planner publish no accuracy figure at all. That gap matters. After all, a single vendor-reported percentage with no disclosed methodology is closer to a marketing headline than a metric you can compare across tools. Most of the category has apparently decided not to publish one at all.
How I Evaluated These Claims
I did not run a controlled forecast test on a live store for this piece. A fair accuracy test needs a full season of held-out data per catalog type. That is a multi-month project on its own, not something to fake with a single anecdote. Instead, I checked what each major Shopify-adjacent forecasting vendor claims publicly. Then I cross-referenced those claims against independent supply-chain benchmark sources that report error rates by product category, sales history length, and volatility, rather than by vendor. A vendor’s single advertised percentage rarely tells you how a tool will perform on a messy real catalog.
MAPE is short for mean absolute percentage error, the most common way to score a forecast. It measures how far off a prediction was from actual demand, expressed as a percentage, and lower is better. For example, a 15 percent MAPE means the forecast was off by 15 percent of actual demand on average. Notably, the vendor claims I found rarely state whether their headline number is a MAPE, an inverse accuracy score, or something else entirely. That ambiguity alone is worth noticing before you trust a single percentage.
AI Demand Forecasting Accuracy Shopify Founders Can Realistically Expect, by Catalog Type
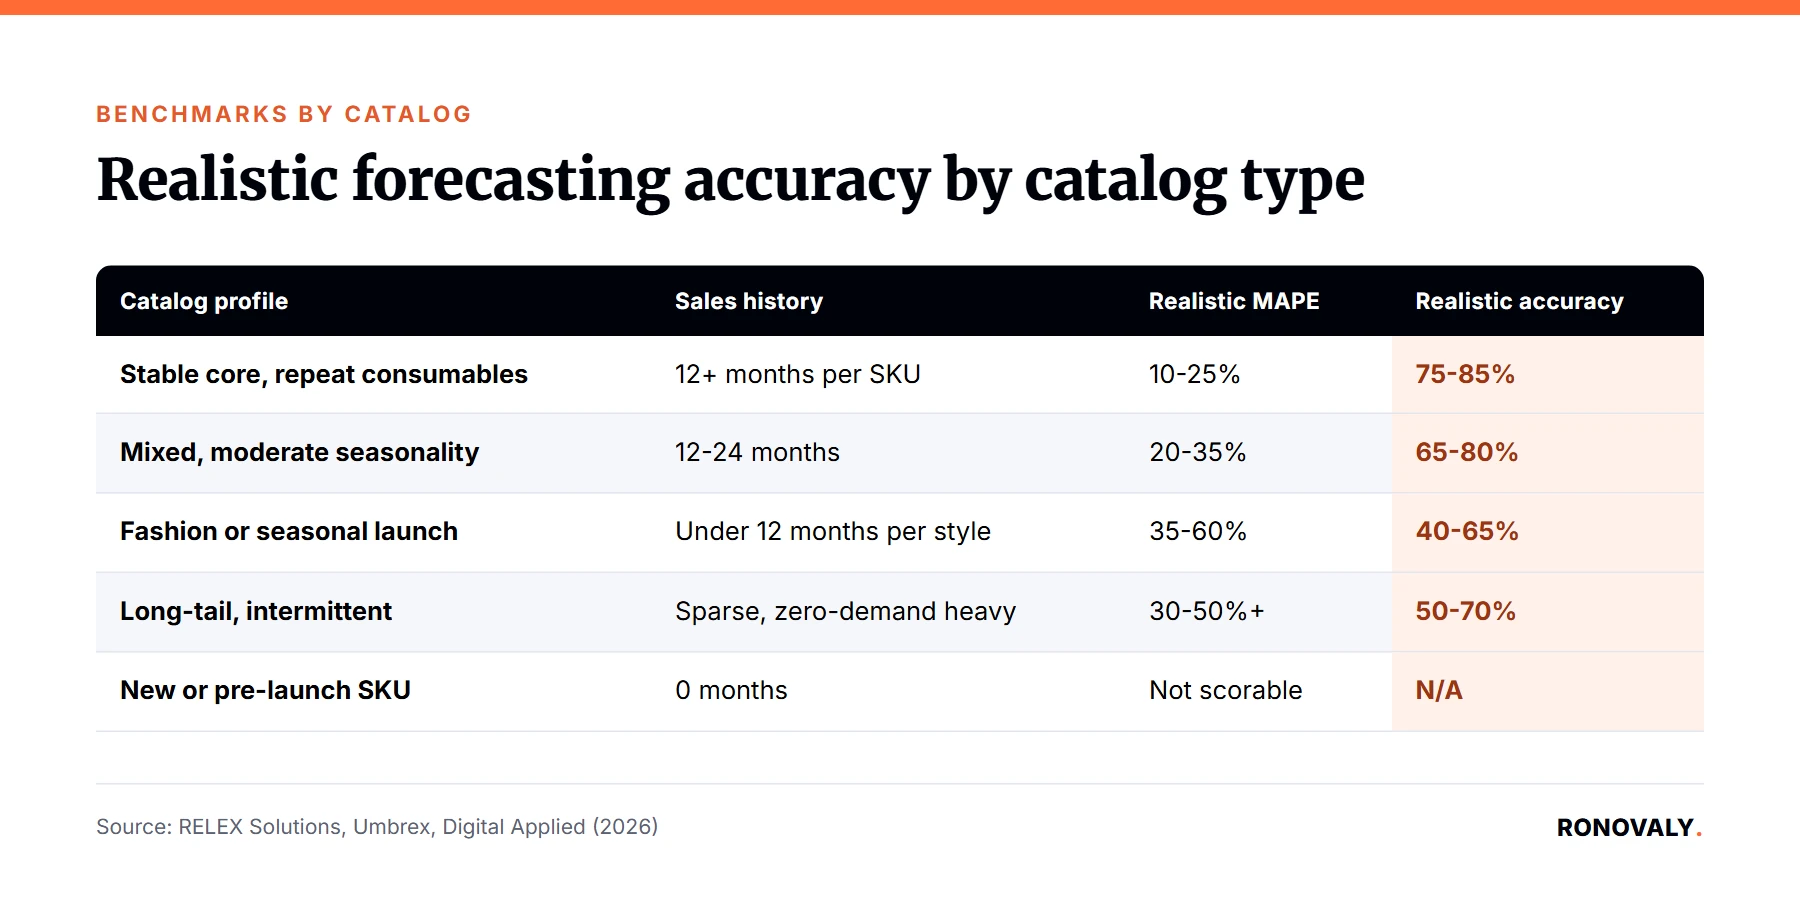
In short, the realistic accuracy range for AI demand forecasting on a Shopify catalog depends far more on your SKU count, sales history, and seasonality than on which tool you buy. Below is the expectations table I built by cross-referencing five independent benchmark sources, none of which are trying to sell you a forecasting tool.
| Catalog profile | Typical sales history | Volatility / seasonality | Realistic accuracy (MAPE) | What degrades it most |
|---|---|---|---|---|
| Stable core catalog, repeat consumables | 12+ months per SKU | Low, steady repeat buys | 10-25% MAPE (roughly 75-85% accuracy) | Untagged promotions or price changes |
| Mixed catalog with moderate seasonality | 12-24 months | Moderate | 20-35% MAPE | Per-variant history too thin to train on |
| Fashion or seasonal-launch heavy | Under 12 months per style | High | 35-60% MAPE | Each new style starts with zero history |
| New product or pre-launch SKU | 0 months | Unknown | Not meaningfully MAPE-scorable | Tools fall back to a category proxy, rarely disclosed |
| Long-tail or intermittent slow movers | Sparse, zero-demand heavy | High | 30-50%+ MAPE (roughly 50-70% accuracy) | Low volume makes each unit swing the percentage |
Sources for this table: RELEX Solutions’ forecast accuracy guide puts stable high-volume products at 75-85 percent accuracy. It puts slow-movers with intermittent demand at 50-70 percent (RELEX Solutions, “Measuring forecast accuracy: The complete guide”, checked 2026-09-04). Similarly, Umbrex’s supply-chain playbook puts apparel and fashion MAPE at 35-60 percent. It puts industrial or B2B demand at 20-40 percent at the SKU level (Umbrex, “Forecast Accuracy by Product”, checked 2026-09-04). SoftServe Business Systems, meanwhile, notes that 30 percent-plus MAPE is common at the SKU level. It describes that result plainly as weak accuracy (SoftServe Business Systems, “SKU-level Demand Forecasting Guide”, published 2026-04-15).
Why Do New Products and Seasonal Launches Break the Model?
A brand-new product with zero sales history cannot be meaningfully scored on MAPE. That is because MAPE measures error against actual demand that hasn’t happened yet. As a workaround, forecasting tools handle this gap by quietly substituting a category average or a similar product’s curve. In other words, it’s a fallback that vendor marketing pages almost never mention. Digital Applied’s 2026 guide states plainly that AI forecasting for a brand-new launch remains “theoretical” without a human checking it against comparable products (Digital Applied, “AI Demand Forecasting for Ecommerce Inventory 2026”, published 2026-06-30).
This is exactly where fashion and seasonal-drop catalogs suffer. If most of your SKUs are new every season, the model is effectively re-learning from scratch every few months. That is why Umbrex’s benchmark puts that category at 35 to 60 percent MAPE, against 10 to 25 percent for stable staples. If your catalog fits this pattern, treat the AI forecast as one input for a launch quantity decision, not the decision itself. As a result, keep a manual buffer for the first cycle of any genuinely new style.
How Much Sales History Do You Actually Need Before Trusting the Forecast?
Plan on roughly 6 to 12 months of clean sales history before a machine-learning forecast reliably outperforms a simple average or your own gut call. That baseline comes from Digital Applied’s 2026 guide, and it shifts by product type. Specifically, steady, high-volume items can work with as little as 8 to 12 weeks. Seasonal items need at least one full season, and ideally two years, so the model has actually seen the pattern repeat. Intermittent or long-tail items need 12 or more months, including the zero-demand weeks, since those gaps are part of the pattern the model has to learn.
A “clean” history is a sales record that reflects real, unconstrained demand rather than stockouts, manual price overrides, or unflagged promotions. Notably, it matters as much as a long one. A messy history teaches the model the wrong pattern no matter how many months you feed it. Therefore, before you trust a forecast, check whether your sales data actually reflects real demand or months where you simply ran out of stock. My guide on auditing hidden costs across your AI app stack covers a similar principle: check what a tool is actually working with before you trust what it outputs.
What Actually Degrades Accuracy Once a Tool Is Live?
Data quality is the single biggest gap between a vendor’s advertised accuracy and what a store actually sees. Shopify’s own 2026 guidance cites a PwC study on this point. That study found 87 percent of brands say poor data has already hurt their ability to get value from AI. It separately cites McKinsey research that roughly a third of firms report real harm from bad AI output (Shopify, “AI Demand Forecasting for Ecommerce (2026)”, published 2026-07-07). Tellingly, that same article notes one merchant cut their forecasting team from three people to one, since the AI output still needed a human to check it first.
What else moves the number besides data quality? Catalog size is a second, more mechanical factor. A spreadsheet stays workable for a few dozen steady-demand SKUs, per Digital Applied’s guide. However, it breaks down past roughly a few hundred SKUs with any seasonal mix, which is where a real tool starts paying for itself. Below that line, the AI tool isn’t wrong so much as unnecessary.
Surprises: Where the Marketing and the Data Disagree
Two things surprised me in this evaluation. First, most established forecasting vendors do not publish a numeric accuracy claim at all. Netstock, Cogsy, and Inventory Planner all skip a specific percentage. Prediko, a comparatively newer entrant, is the one publishing a headline 95 percent figure. That is the opposite of what I expected. If anything, an unverifiable, unsourced 95 percent claim is easier to publish than a defensible, methodology-backed one. Consequently, the more established players may be avoiding the number for that reason.
Second, I found something I haven’t seen elsewhere: one analyst firm retracted its own previously published benchmark table. Planster’s co-founder wrote that “every range we could find traced back to another article quoting a third, with no study, methodology or sample at the end of the chain.” As a result, he pulled the numbers rather than keep circulating them. That quote comes straight from his own retraction post (Steve Clark, Planster, “Forecast Accuracy Benchmarks: What’s Good Enough?”, updated 2026-09-01).
What this tells us: the accuracy percentage on a vendor’s homepage is closer to a claim than a spec sheet. Treat every unsourced benchmark, including some in this table’s sources, as a starting estimate to test against your own catalog, not a number to plan a season around.
Limitations of This Evaluation
This is a synthesis of published vendor claims and independent benchmarks, not a live test. As a result, treat the MAPE ranges above as a starting expectation, not a guarantee.
What this evaluation doesn’t cover:
– Enterprise ERP-connected tools like Netstock, built for larger, multi-location operations outside this piece’s small-to-midsize Shopify focus.
– Real-time signals such as weather, local events, or competitor pricing. Several tools claim to use these, but no source here isolated them as a separate accuracy factor.
Open questions for future research:
– Whether one vendor’s accuracy holds up against a held-out season of real order data.
– How much the vendor-versus-benchmark gap closes as tools accumulate more Shopify-specific training data.
What Does This Mean for Your Shopify Store?
First, match your expectation to your catalog profile before you buy or renew a forecasting tool. Then use the table above as your starting point.
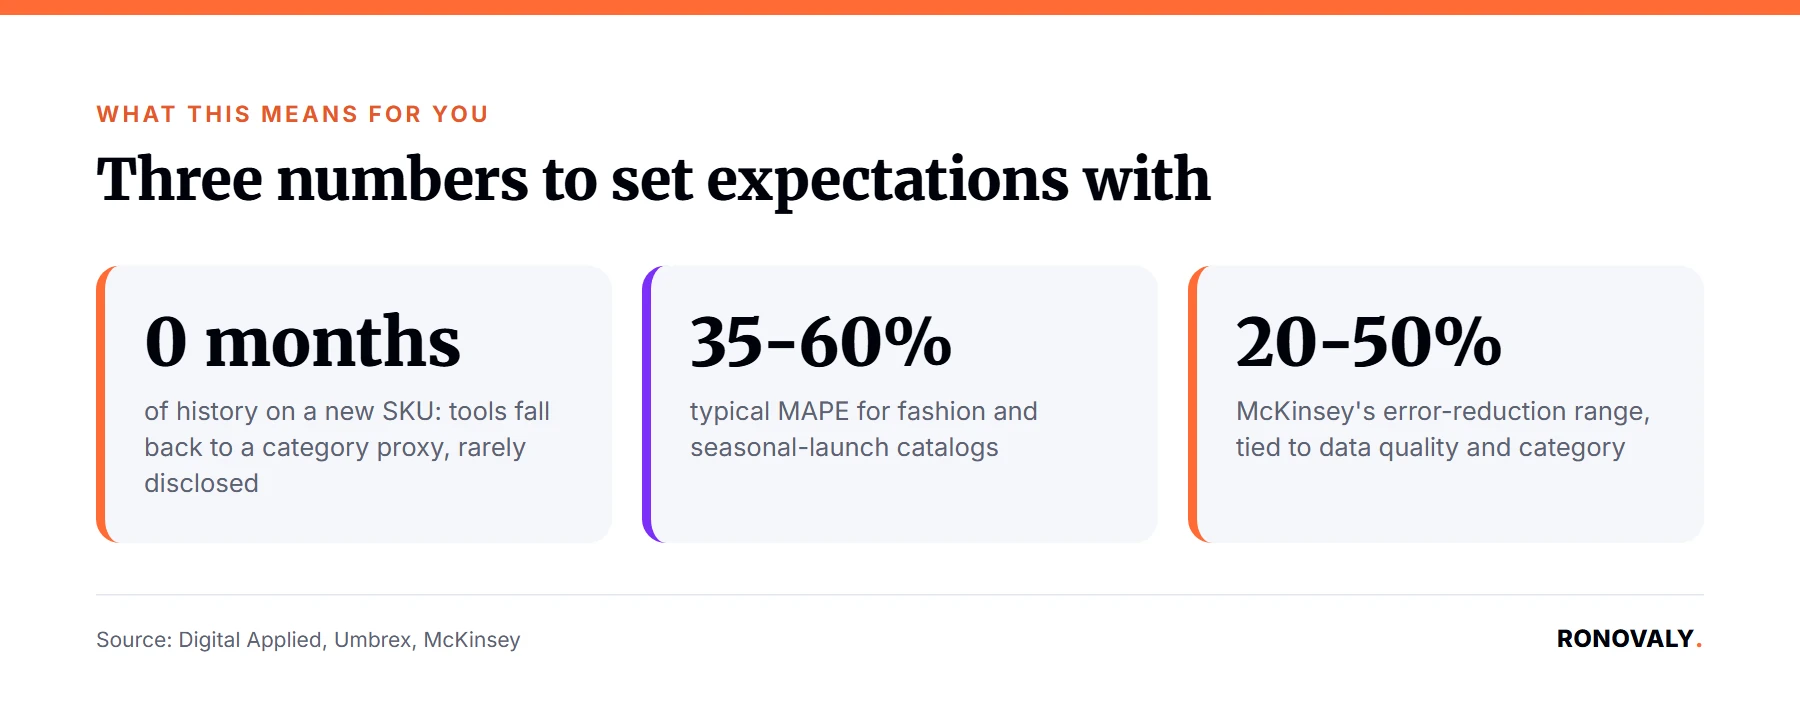
If your catalog is mostly stable, repeat-purchase SKUs with 12-plus months of clean history: expect accuracy in the 75 to 85 percent range. Treat anything a vendor claims well above that as unverified until you can check it against your own reorder outcomes for a full quarter.
If your catalog is fashion, seasonal, or launch-heavy: expect 35 to 60 percent MAPE and budget a manual buffer for every new style’s first cycle. No AI tool currently claims to solve the zero-history problem, whatever the accuracy number on its homepage.
If you’re under a few hundred SKUs with steady demand: a spreadsheet and your own judgment may still outperform the cost and setup time of a dedicated AI forecasting tool, based on Digital Applied’s crossover threshold.
If you’re deciding whether AI forecasting fits into your broader operations, my AI-driven decision making guide for Shopify founders covers how to weigh a tool like this against the rest of your stack, not just in isolation.
Related guides: for next steps, see whether AI dynamic pricing works for small brands.
Frequently Asked Questions
What does MAPE mean, and why does it matter more than a single accuracy percentage?
MAPE, mean absolute percentage error, measures how far a forecast was from actual demand, expressed as a percentage, with lower being better. A single accuracy percentage without a stated MAPE band or baseline tells you almost nothing about how a tool performs across different SKU types.
Does AI demand forecasting work for a brand-new product with no sales history?
Not in a way that produces a meaningful MAPE score. Tools typically substitute a category average or comparable product’s curve for brand-new SKUs, a fallback rarely disclosed on marketing pages. Treat AI output for new launches as one input, not the final call, per Digital Applied’s 2026 guidance.
How much sales history do I need before an AI forecasting tool beats a spreadsheet?
Plan on roughly 6 to 12 months of clean sales history for most catalogs, 8 to 12 weeks for steady high-volume items, and a full season, ideally two years, for seasonal products, according to Digital Applied’s 2026 forecasting guide.
Why would a tool that advertises 95 percent accuracy still get my reorder quantities wrong?
Headline accuracy figures like Prediko’s roughly 95 percent claim are typically averages across the vendor’s full customer base, with no published MAPE band or baseline. Your specific SKU’s volatility, history length, and data quality can put your real result well outside that average.
Is AI demand forecasting worth setting up for a small Shopify catalog?
It depends on SKU count and seasonality more than store revenue. Digital Applied’s guide puts the crossover point at roughly a few hundred SKUs with a seasonal mix. Below that, with steady demand, a spreadsheet and manual review can still outperform a dedicated forecasting tool’s cost and setup time.
How much does seasonality change the accuracy I should expect?
Substantially. RELEX Solutions puts stable, high-volume products at 75 to 85 percent accuracy. By contrast, Umbrex’s benchmark framework puts fashion and seasonal-launch categories at 35 to 60 percent MAPE, since each new seasonal style starts with little to no sales history to train on.
Data Appendix
Summary Data Table
| Catalog profile | Realistic MAPE | Realistic accuracy | Primary source |
|---|---|---|---|
| Stable core catalog | 10-25% | 75-85% | RELEX Solutions, 2026 |
| Mixed, moderate seasonality | 20-35% | 65-80% | Umbrex; Digital Applied, 2026 |
| Fashion / seasonal launch | 35-60% | 40-65% | Umbrex, 2026 |
| New / pre-launch SKU | Not scorable | N/A | Digital Applied, 2026 |
| Long-tail / intermittent | 30-50%+ | 50-70% | RELEX Solutions, 2026 |
Citation format: Alex Carter, “AI Demand Forecasting Accuracy Shopify: What to Expect,” Ronovaly, 2026-09-04, https://ronovaly.com/ai-demand-forecasting-accuracy-shopify/.
Next Steps
The gap between what vendors advertise and what independent data shows is real. Still, it’s predictable once you know your catalog’s history length, volatility, and seasonality. Use the table above to set your expectation before you buy. Then check the tool’s actual output against your own reorder outcomes for a full quarter before you trust it over your own judgment.
If you’re still setting up AI forecasting for the first time, start with my inventory forecasting setup guide, then treat this piece as the reality check to revisit once real data starts coming in.
This post contains affiliate links. If you make a purchase through these links, we may earn a commission at no extra cost to you.